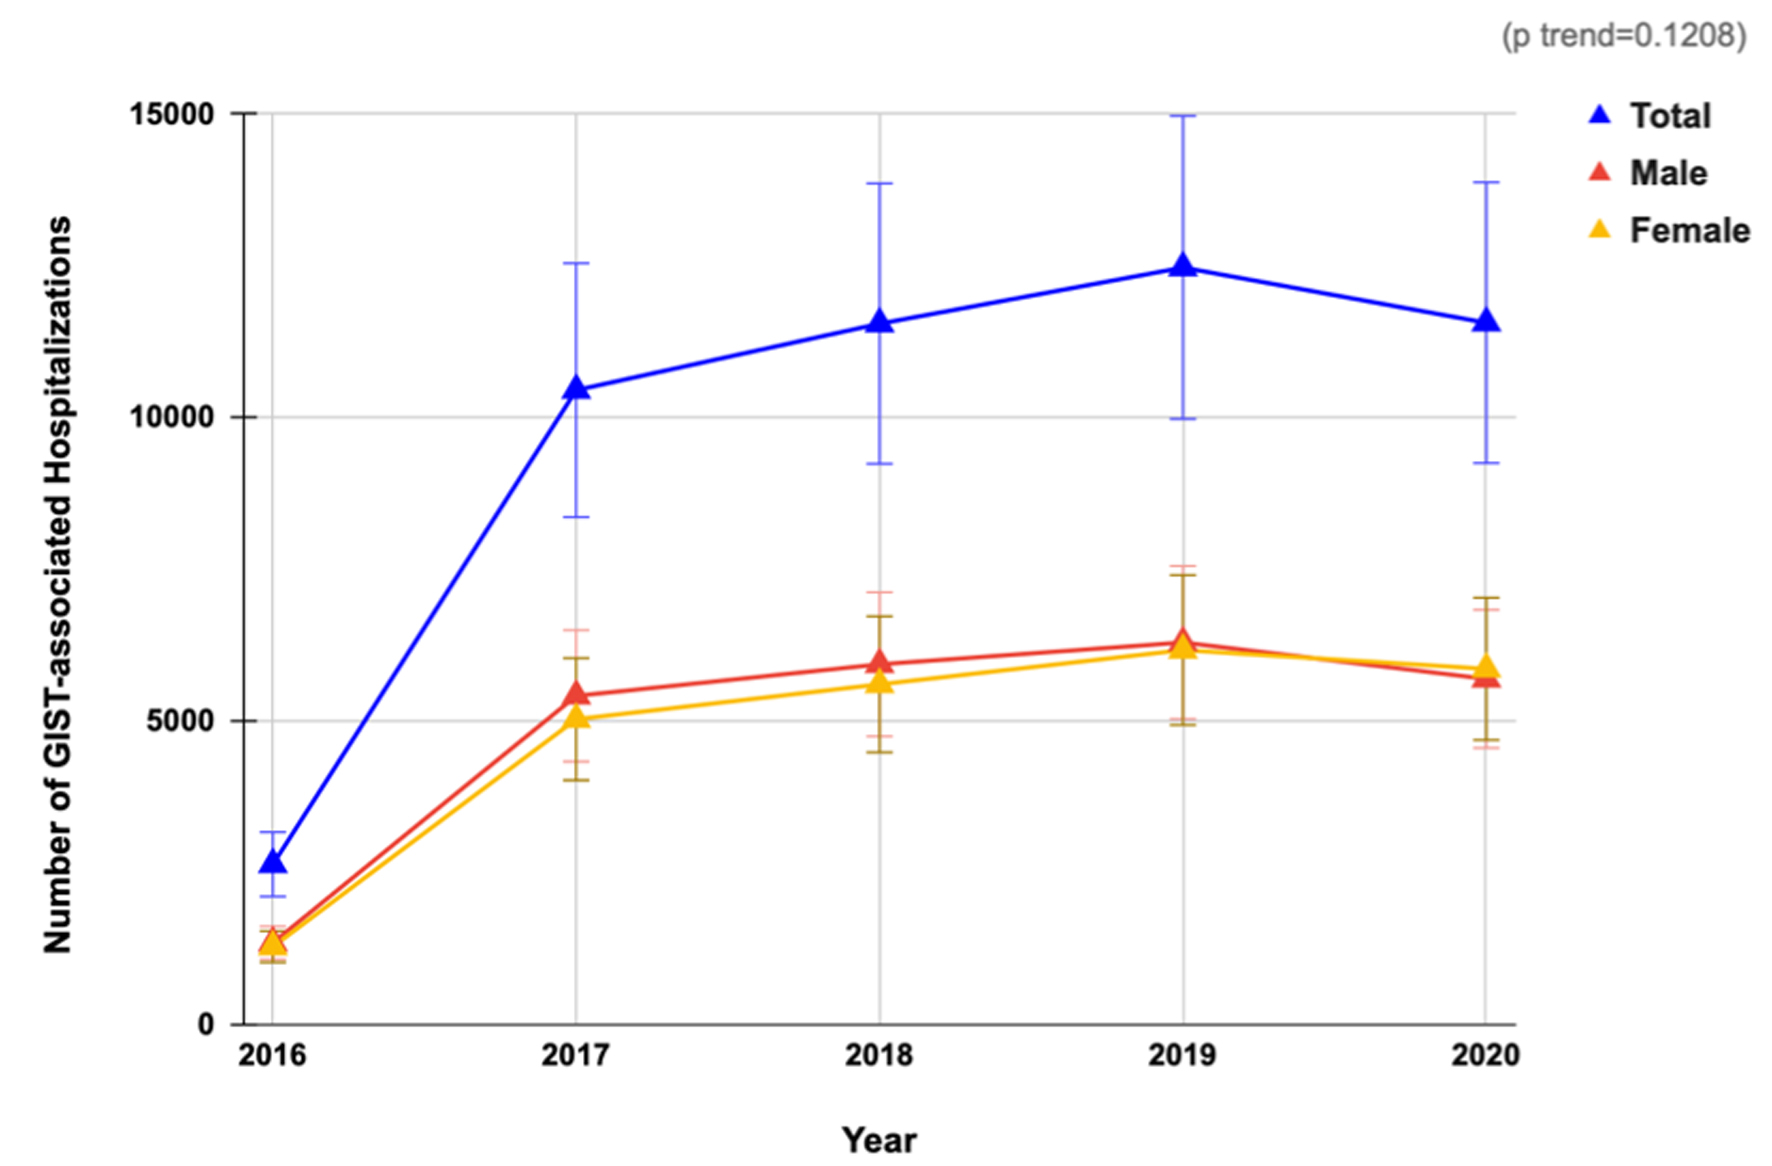
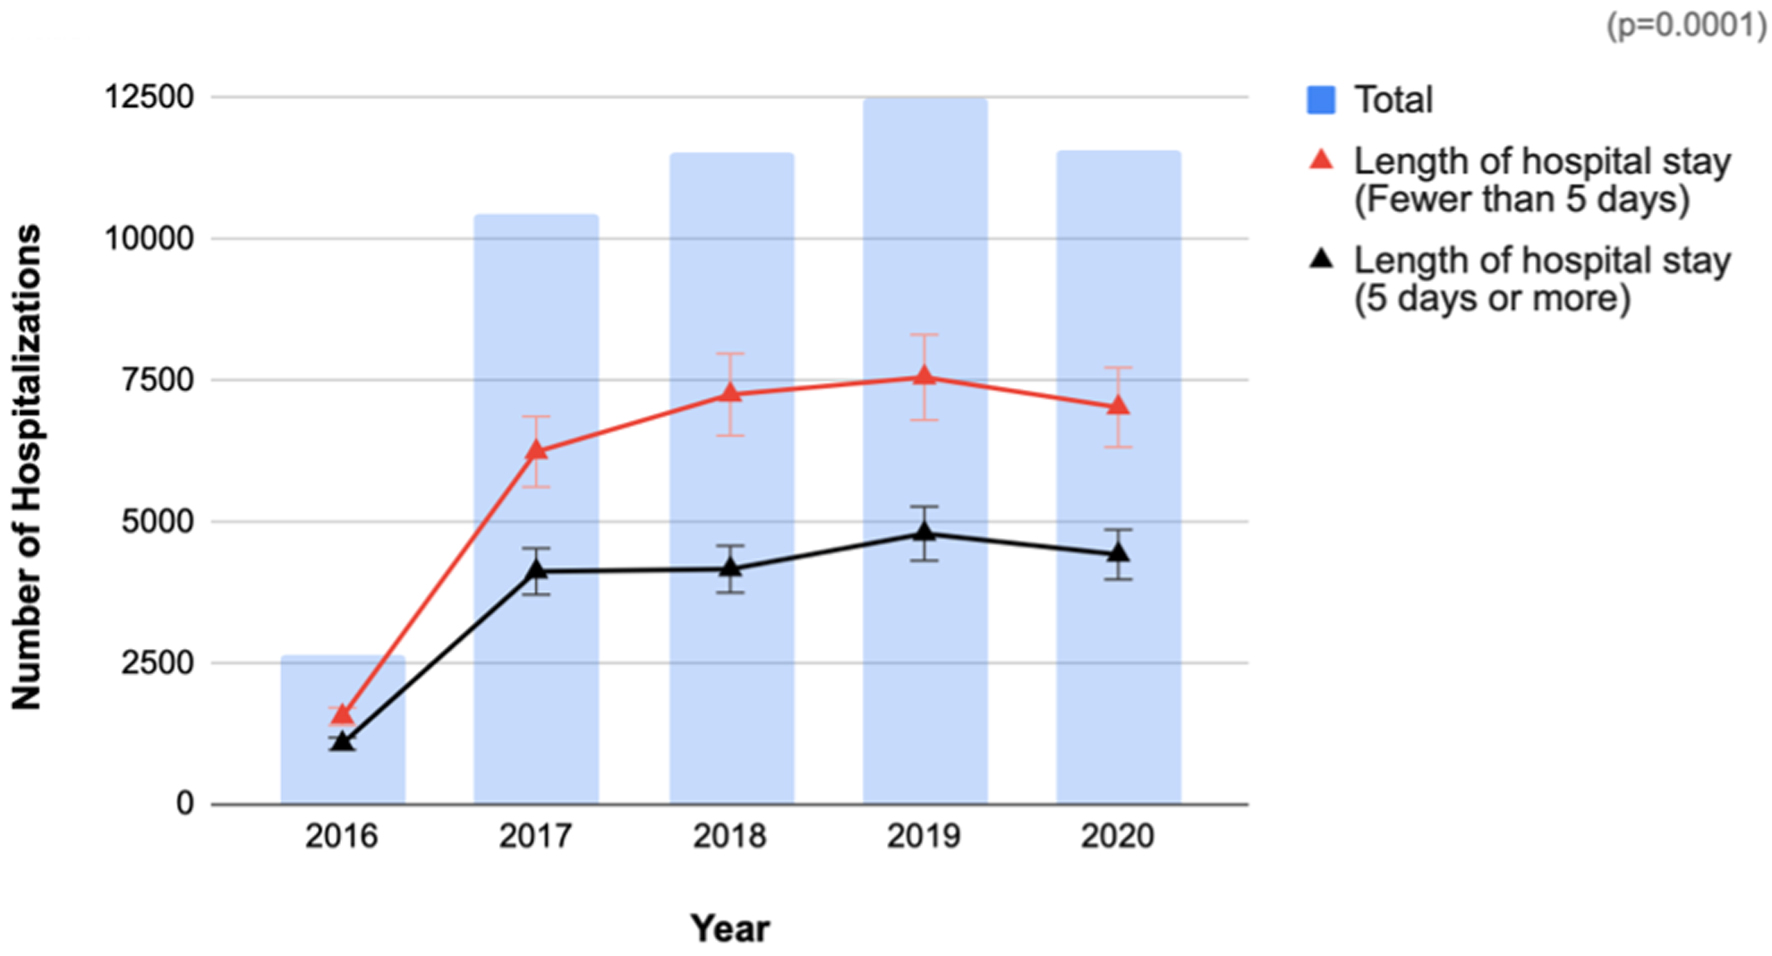
Figure 1. Annual trends in hospitalizations for gastrointestinal stromal tumors: analysis of the National Inpatient Sample 2016 - 2020.
| Gastroenterology Research, ISSN 1918-2805 print, 1918-2813 online, Open Access |
| Article copyright, the authors; Journal compilation copyright, Gastroenterol Res and Elmer Press Inc |
| Journal website https://gr.elmerpub.com |
Original Article
Volume 18, Number 1, February 2025, pages 12-22
Trends and Financial Burden of Gastrointestinal Stromal Tumors in the United States: A Comprehensive Analysis of United States Hospitalizations
Figures

Tables
| Characteristics | 2016 | 2017 | 2018 | 2019 | 2020 |
|---|---|---|---|---|---|
| GIST: gastrointestinal stromal tumor; NIS: National Inpatient Sample. | |||||
| Total | 2,645 | 10,455 | 11,550 | 12,475 | 11,565 |
| Age (years), N (%) | |||||
| 18 - 44 | 160 (6.0%) | 655 (6.3%) | 855 (7.4%) | 785 (6.3%) | 830 (7.2%) |
| 45 - 64 | 960 (36.3%) | 3,740 (35.8%) | 3,955 (34.2%) | 4,265 (34.2%) | 3,775 (32.6%) |
| 65 - 84 | 1,280 (48.4%) | 5,235 (50.1%) | 5,740 (49.7%) | 6,245 (50.1%) | 5,915 (51.1%) |
| > 84 | 250 (9.5%) | 825 (7.9%) | 1,000 (8.7%) | 1,180 (9.5%) | 1,020 (8.8%) |
| Sex, N (%) | |||||
| Male | 1,355 (51.2%) | 5,420 (51.8%) | 5,940 (51.4%) | 6,300 (50.5%) | 5,700 (49.3%) |
| Female | 1,290 (48.8%) | 5,035 (48.2%) | 5,610 (48.6%) | 6,175 (49.5%) | 5,865 (50.7%) |
| Race, N (%) | |||||
| White | 1,595 (60.3%) | 6,010 (57.5%) | 6,725 (58.2%) | 7,380 (59.2%) | 6,790 (58.7%) |
| Black | 535 (20.2%) | 2,170 (20.8%) | 2,540 (22.0%) | 2,675 (21.4%) | 2,360 (20.4%) |
| Hispanic | 155 (5.9%) | 835 (8.0%) | 935 (8.1%) | 1,030 (8.3%) | 1,105 (9.6%) |
| Asian or Pacific Islander | 130 (4.9%) | 650 (6.2%) | 545 (4.7%) | 735 (5.9%) | 725 (6.3%) |
| Native American | 15 (0.6%) | 35 (0.3%) | 30 (0.3%) | 40 (0.3%) | 25 (0.2%) |
| Other | 95 (3.6%) | 420 (4.0%) | 490 (4.2%) | 395 (3.2%) | 360 (3.1%) |
| Region of hospital, N (%) | |||||
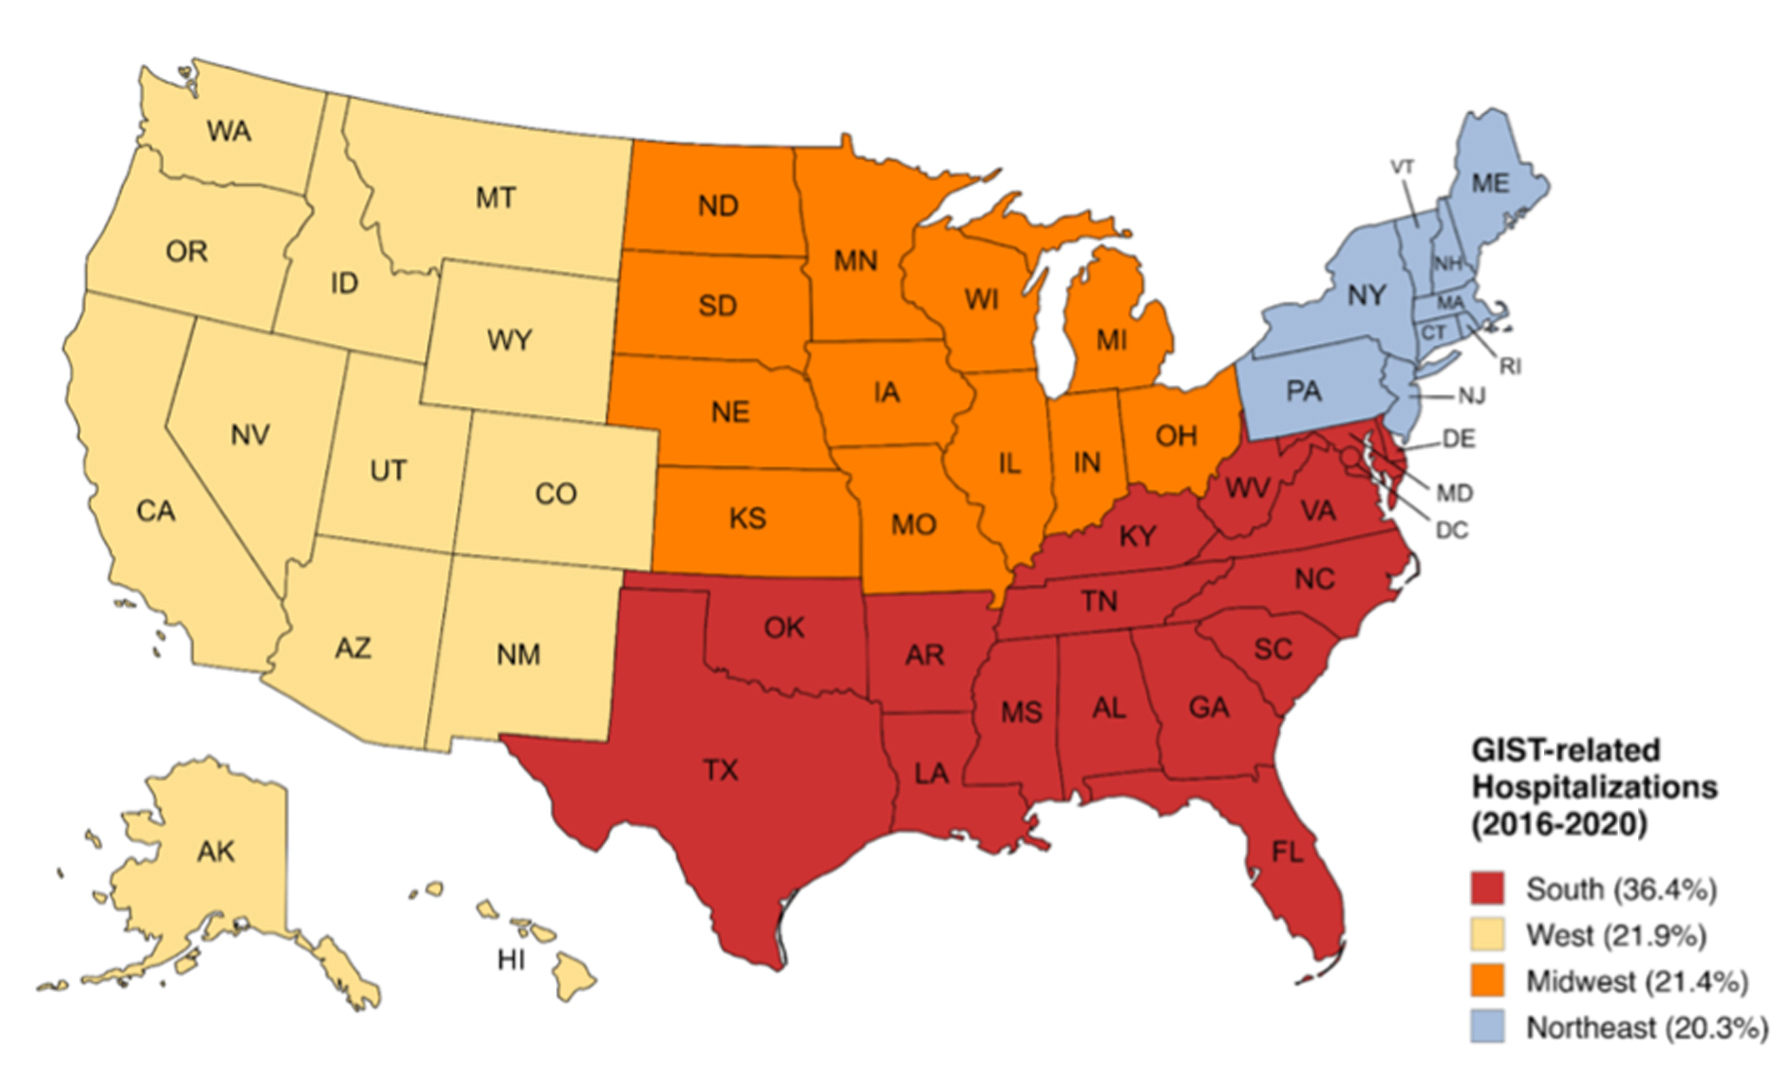
| Northeast | 560 (21.2%) | 2,055 (19.7%) | 2,290 (19.8%) | 2,655 (21.3%) | 2,335 (20.2%) |
| Midwest | 565 (21.4%) | 2,415 (23.1%) | 2,485 (21.5%) | 2,620 (21.0%) | 2,345 (20.3%) |
| South | 925 (35.0%) | 3,695 (35.3%) | 4,230 (36.6%) | 4,580 (36.7%) | 4,290 (37.1%) |
| West | 600 (22.7%) | 2,290 (21.9%) | 2,545 (22.0%) | 2,620 (21.0%) | 2,595 (22.4%) |
| Status of the hospital, N (%) | |||||
| Rural | 115 (4.3%) | 405 (3.9%) | 475 (4.1%) | 420 (3.4%) | 475 (4.1%) |
| Urban non-teaching | 430 (16.3%) | 1,675 (16.0%) | 1,515 (13.1%) | 1,390 (11.1%) | 1,520 (13.1%) |
| Urban teaching | 2,105 (79.6%) | 8,375 (80.1%) | 9,560 (82.8%) | 10,665 (85.5%) | 9,570 (82.7%) |
| Median household income for patient’s zip code (based on current year), N (%) | |||||
| 0 to 25th percentile | 710 (26.8%) | 2,725 (26.1%) | 3,135 (27.1%) | 3,255 (26.1%) | 2,820 (24.4%) |
| 26th to 50th percentile (median) | 560 (21.2%) | 2,325 (22.2%) | 2,780 (24.1%) | 2,680 (21.5%) | 2,855 (24.7%) |
| 51st to 75th percentile | 650 (24.6%) | 2,505 (24.0%) | 2,735 (23.7%) | 3,090 (24.8%) | 2,645 (22.9%) |
| 76th to 100th percentile | 655 (24.8%) | 2,745 (26.3%) | 2,775 (24.0%) | 3,320 (26.6%) | 3,105 (26.8%) |
| Variable | Cumulative value, N (%) (2016 - 2020) | ||||
| Total (2016 - 2020) | 48,695 | ||||
| Congestive heart failure | 4,950 (10.2%) | ||||
| Chronic pulmonary disease | 7,545 (15.5%) | ||||
| Hypertension | 29,575 (60.7%) | ||||
| Diabetes mellitus | 12,135 (24.9%) | ||||
| Hypothyroidism | 6,565 (13.5%) | ||||
| Renal failure | 6,890 (14.1%) | ||||
| Liver disease | 3,334 (6.8%) | ||||
| Peptic ulcer disease with bleeding | 2,130 (4.4%) | ||||
| Metastatic cancer | 7,665 (15.7%) | ||||
| Elective admission | 18,610 (38.2%) | ||||
| Non-elective admission | 30,030 (61.7%) | ||||
| Coagulopathy | 3,200 (6.6%) | ||||
| Chronic blood loss anemia | 2,050 (4.2%) | ||||
| Alcohol abuse | 1,340 (2.8%) | ||||
| Drug abuse | 609 (1.3%) | ||||
| 2016 | 2017 | 2018 | 2019 | 2020 | P-trend | |
|---|---|---|---|---|---|---|
| GISTs: gastrointestinal stromal tumors; NIS: National Inpatient Sample. | ||||||
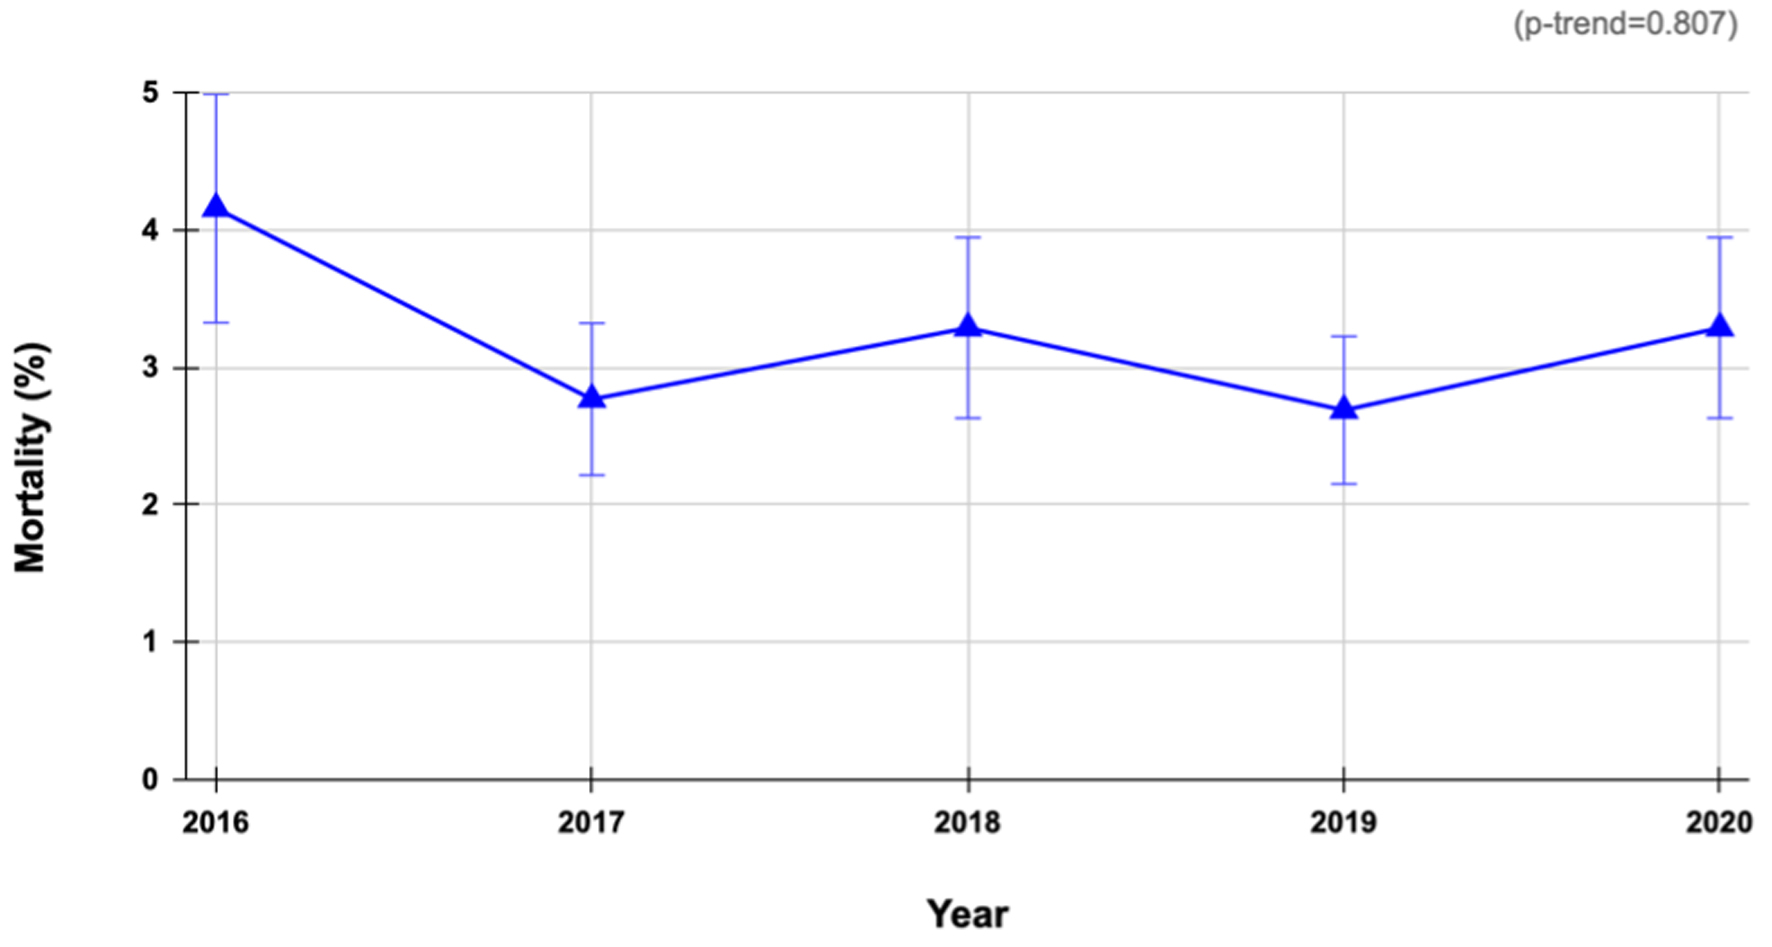
| Mortality, N (%) | 110 (4.16%) | 290 (2.77%) | 380 (3.29%) | 335 (2.69%) | 380 (3.29%) | 0.807 |
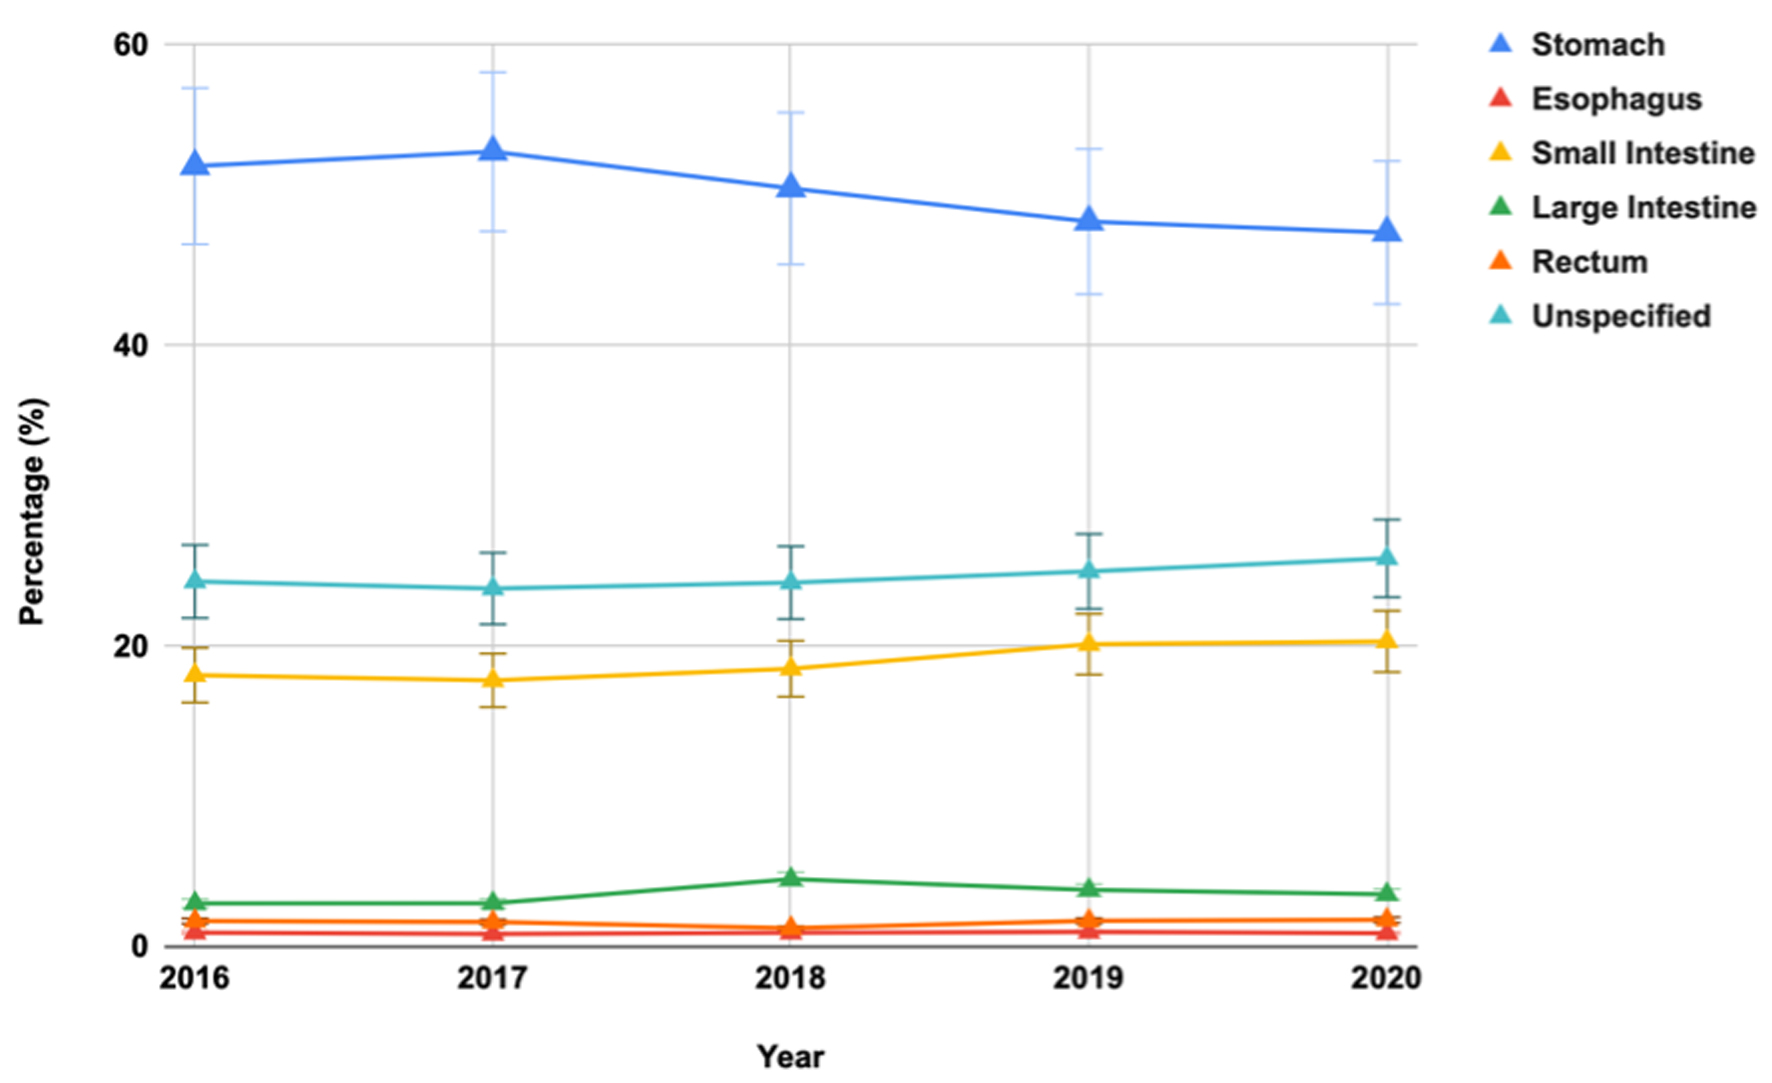
| Tumor location | ||||||
| Esophageal | 25 (0.9%) | 90 (0.9%) | 110 (1.0%) | 125 (1.0%) | 105 (0.9%) | |
| Stomach | 1,335 (50.5%) | 5,335 (51.0%) | 5,735 (49.7%) | 5,880 (47.1%) | 5,330 (46.1%) | |
| Small intestine | 465 (17.6%) | 1,790 (17.1%) | 2,105 (18.2%) | 2,455 (19.7%) | 2,280 (19.7%) | |
| Large intestine | 75 (2.8%) | 295 (2.8%) | 515 (4.5%) | 465 (3.7%) | 395 (3.4%) | |
| Rectum | 45 (1.7%) | 170 (1.6%) | 145 (1.3%) | 215 (1.7%) | 205 (1.8%) | |
| Unspecified | 625 (23.6%) | 2,405 (23.0%) | 2,755 (23.9%) | 3,045 (24.4%) | 2,900 (25.1%) | |
| Length of hospital stay, N (%) | ||||||
| Fewer than 5 days | 1,550 (59.16%) | 6,235 (60.24%) | 7,245 (63.55%) | 7,550 (61.21%) | 7,020 (61.39%) | < 0.0001 |
| 5 days or more | 1,070 (40.84%) | 4,115 (39.76%) | 4,155 (36.45%) | 4,785 (38.79%) | 4,415 (38.61%) | |
| Total hospital charge (USD), N (%) | ||||||
| Up to 10,000 | 905 (34.9%) | 3,485 (33.4%) | 4,005 (34.7%) | 3,925 (31.6%) | 3,240 (28.3%) | |
| 10,000 - 20,000 | 945 (36.5%) | 3,855 (36.9%) | 4,295 (37.2%) | 4,480 (36.1%) | 3,975 (34.7%) | |
| 20,000 - 30,000 | 325 (12.5%) | 1,570 (15.1%) | 1,675 (14.5%) | 1,920 (15.5%) | 2,000 (17.5%) | |
| 30,000 - 40,000 | 200 (7.7%) | 690 (6.6%) | 635 (5.5%) | 755 (6.1%) | 795 (6.9%) | |
| More than 40,000 | 215 (8.3%) | 820 (7.9%) | 925 (8.0%) | 1,335 (10.7%) | 1,445 (12.6%) | |
| Mean total hospital charge adjusted for inflation (USD) | 20,242 | 19,373 | 18,902 | 21,033 | 22,905 | < 0.0001 |
| 2016 | 2017 | 2018 | 2019 | 2020 | Total | P-trend | |
|---|---|---|---|---|---|---|---|
| GISTs: gastrointestinal stromal tumors; NIS: National Inpatient Sample. | |||||||
| Endoscopic excision, N (%) | 69 (13.02%) | 228 (10.9%) | 246 (10.65%) | 296 (11.86%) | 301 (13.01%) | 1,140 | 0.08 |
| Surgical resection, N (%) | 21 (3.96%) | 107 (5.12%) | 107 (4.63%) | 123 (4.93%) | 131 (5.66%) | 489 | 0.16 |
| Surgical excision, N (%) | 142 (26.8%) | 490 (23.4%) | 539 (23.3%) | 544 (21.8%) | 494 (21.4%) | 2,209 | 0.0045 |