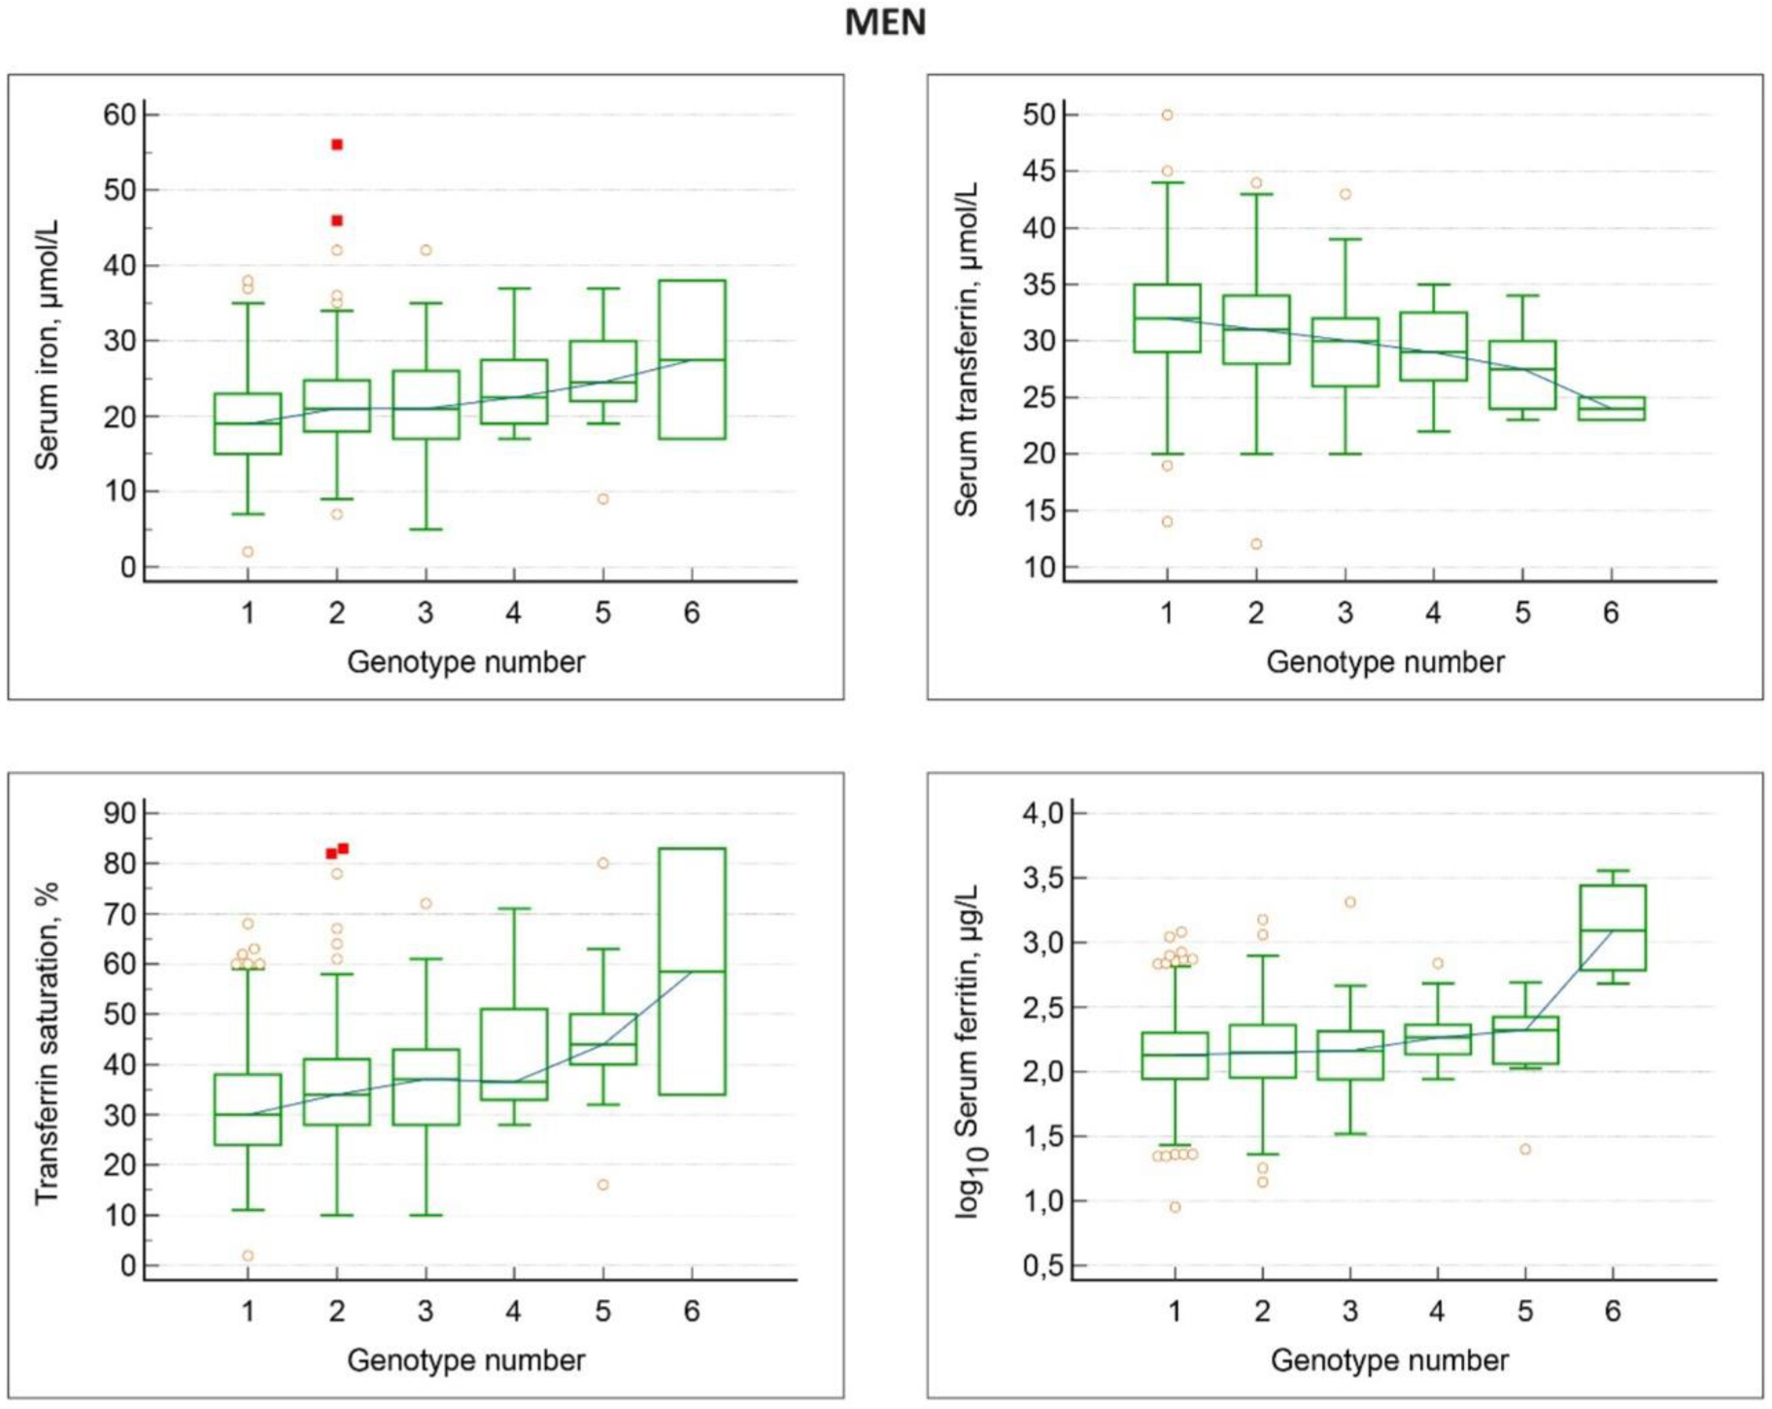
Gastroenterology Research, ISSN 1918-2805 print, 1918-2813 online, Open Access
Article copyright, the authors; Journal compilation copyright, Gastroenterol Res and Elmer Press Inc
Journal website https://gr.elmerpub.com

Original Article

Volume 000, Number 000, March 2025, pages 000-000


Associations Between the HFE Genotypes and Iron Status Markers in an Apparently Healthy Population

Figures

Figure 1.
Figure 1. Associations between HFE genotypes and iron status markers in men, non-blood donors. Genotype numbers denote: 1 wt/wt; 2 H63D/wt; 3 C282Y/wt; 4 H63D/H63D; 5 C282Y/H63D; 6 C28Y/C282Y. With increasing genotype number, there is a gradual increase in serum iron, transferrin saturation and serum ferritin, and a gradual decrease in serum transferrin.
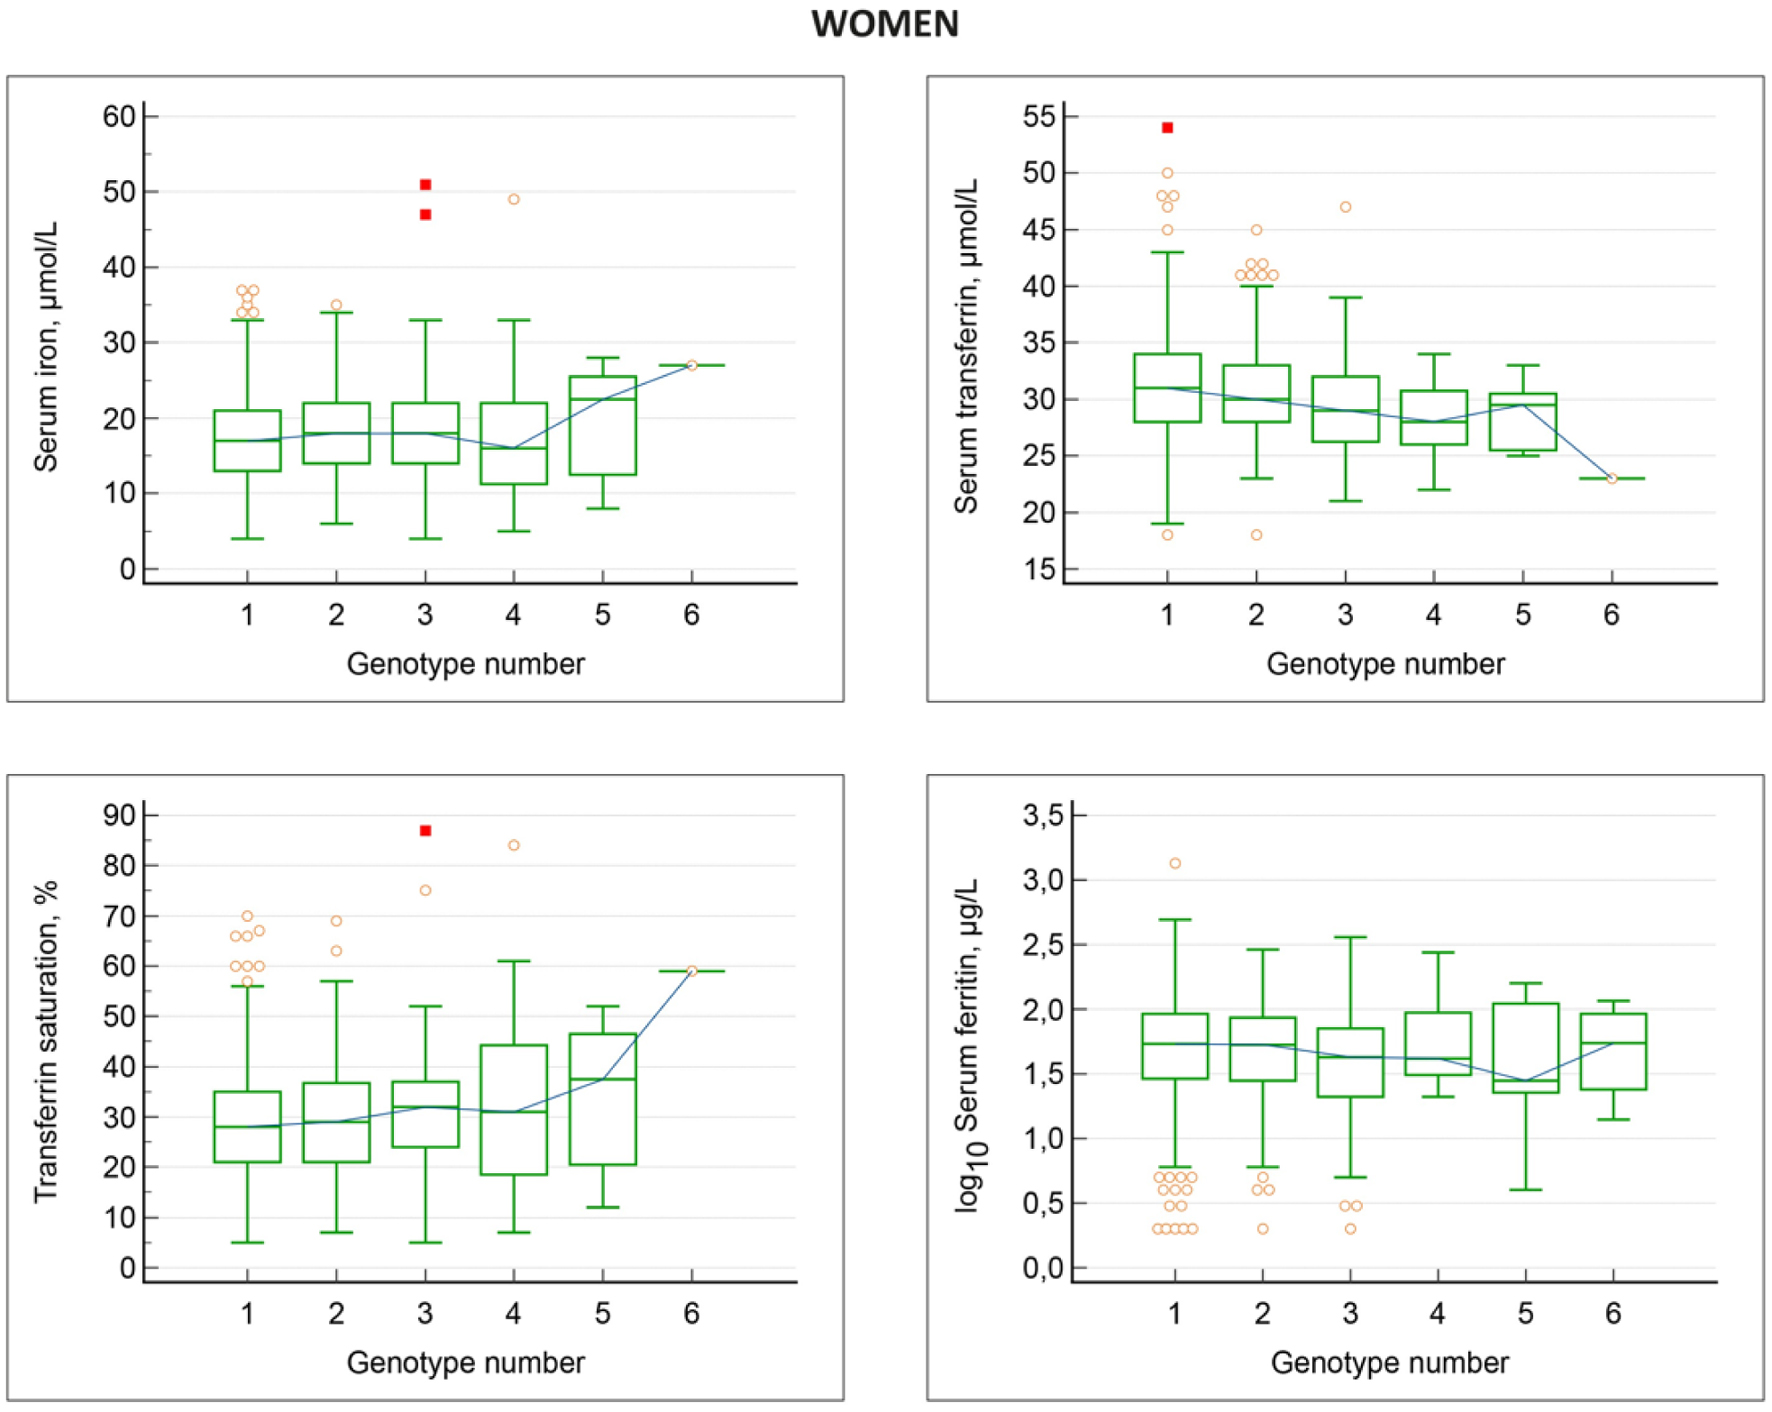
Figure 2.
Figure 2. Associations between HFE genotypes and iron status markers in women, non-blood donors. Genotype numbers denote: 1 wt/wt; 2 H63D/wt; 3 C282Y/wt; 4 H63D/H63D; 5 C282Y/H63D; 6 C28Y/C282Y. With increasing genotype number, there is a gradual decrease in serum transferrin and increase in transferrin saturation. Serum iron is elevated only in the C282Y/H63D and C28Y/C282Y genotypes, while serum ferritin is by and large similar in all genotypes.

Tables

Table 1. Distribution of HFE Genotypes in the Entire Series
 
HFE genotypeMen, nWomen, nTotal, n (%)
Fisher’s exact test: no significant differences in genotype distribution between men and women. wt: wildtype.
1. wt/wt8918181,709 (65.40%)
2. H63D/wt287292579 (22.16%)
3. C282Y/wt118120238 (9.11%)
4. H63D/H63D261642 (1.61%)
5. C282Y/H63D162036 (1.38%)
6. C282Y/C282Y459 (0.34%)
Total, n1,3421,2712,613


Table 2. Hematological Iron Status Markers in Men and Women in the Entire Series
 
VariableMenWomenP-value*P-value**
Values are arithmetic mean ± standard deviation. *Student’s t-test for unpaired values, two-tailed probability, significance level with Bonferroni’s correction P < 0.01. **Mann-Whitney rank sum test, two-tailed probability. IQR: interquartile range.
Hemoglobin, g/L158 ± 11.4 (n = 1,336)141 ± 10.7 (n = 1,265)< 0.0001< 0.0001
S-iron, µmol/L20.5 ± 6.5 (n = 900)17.8 ± 6.2 (n = 916)< 0.0001< 0.0001
S-transferrin, µmol/L31.4 ± 4.8 (n = 900)31.1 ± 4.8 (n = 916)0.090.04
S-transferrin saturation, %33.3 ± 11.9 (n = 900)29.5 ± 11.5 (n = 916)< 0.0001< 0.0001
S-ferritin, µg/L, median (IQR)128 (80 - 198)50 (27 - 86)< 0.0001


Table 3. Hematological Iron Status Markers in Men, Non-Blood Donors, According to HFE Genotypes
 
HFE genotypeHemoglobin, g/LS-iron, µmol/LS-transferrin, µmol/LS-transferrin saturation, %S-ferritin, µg/L, median (IQR)
Values are arithmetic mean ± standard deviation. Significance level P < 0.05. ANOVA: analysis of variance; IQR: interquartile range; wt: wildtype.
1. wt/wt158 ± 11.3 (n = 669)19.7 ± 5.931.7 ± 4.831.8 ± 10.5 (n = 441)134 (87 - 200) (n = 666)
2. H63D/wt159 ± 11.1 (n = 205)21.5 ± 7.030.9 ± 5.035.9 ± 12.7 (n = 135)140 (90 - 229) (n = 204)
3. C282Y/wt159 ± 10.7 (n = 78)21.2 ± 6.829.5 ± 4.436.9 ± 13.3 (n = 52)145 (87 - 205) (n = 77)
4. H63D/H63D158 ± 13.7 (n = 18)23.8 ± 6.129.2 ± 4.041.5 ± 12.8 (n = 12)185 (136 - 230) (n = 18)
5. C282Y/H63D159 ± 9.7 (n = 11)24.8 ± 7.727.8 ± 4.045.8 ± 17.1 (n = 10)209 (115 - 264) (n = 11)
6. C282Y/C282Y166 ± 13.4 (n = 3)17; 3825; 2334; 83 (n = 2)1,240 (671 - 3,010) (n = 3) 481; 1,240; 3,600 µg/L
Kruskal-Wallis test, P-value0.40.00060.00010.00050.004
One-way ANOVA F-test, P-value0.40.001< 0.001< 0.001< 0.001


Table 4. Differences Between Iron Status Markers in Men, Non-Blood Donors, According to HFE Genotypes
 
HFE genotypeS-ironS-transferrinS-transferrin saturationS-ferritin
P-valuesP-valuesP-valuesP-values
Values used for calculation of significances are shown in Table 3. Student’s t-test for unpaired values, two-tailed probability. Significance level with Bonferroni’s correction P < 0.005.
wt/wt vs. H63D/wt0.00010.08< 0.00010.1
wt/wt vs. C282Y/wt0.0090.0001< 0.00010.5
wt/wt vs. C282Y/H63D0.0010.0023< 0.00010.2
wt/wt vs. H63D/H63D0.00040.5< 0.00010.024
wt/wt vs. C282Y/C282Y0.0660.0200.0003< 0.0001
H63D/wt vs. C282Y/wt1.00.0190.20.8
C282Y/wt vs. C282Y/H63D0.40.20.060.4
C282Y/H63D vs. H63D/H63D1.00.060.010.7
H63D/H63D vs. C282Y/C282Y0.70.080.3< 0.0001


Table 5. Frequencies of High Transferrin Saturation Values in Various HFE Genotype Groups and Their Relationship With High Serum Ferritin Values in Men and Women, Non-Blood Donors
 
HFE genotypeMen, non-blood donors, nTransferrin saturation > 50%, n (%)S-ferritin > 300 µg/L, nWomen, non-blood donors, nTransferrin saturation > 45%, n (%)S-ferritin > 200 µg/L, n
1. wt/wt44124 (5.4%)5/2451736 (7.0%)1/36
2. H63D/wt13515 (11.1%)3/1517511 (6.3%)1/11
3. C282Y/wt527 (13.5%)3/7799 (11.4%)0/9
4. H63D/H63D122 (16.7%)0/2114 (36.4%)0/4
5. C282Y/H63D103 (30.0%)0/3122 (16.7%)0/2
6. C282Y/C282Y21 (50.0%)1/111 (100.0%)0/1
Chi-squared test, P-value0.00100.5< 0.00010.2
Chi-squared test for trend, P-value< 0.00010.80.00150.7


Table 6. Hematological Iron Status Markers in Women, Non-Blood Donors, According to HFE Genotypes
 
HFE genotypeHemoglobin, g/LS-iron, µmol/LS-transferrin, µmol/LS-transferrin saturation, %S-ferritin, µg/L, median (IQR)
Values are arithmetic mean ± standard deviation. Significance level P < 0.05. aAll four were premenopausal. ANOVA: analysis of variance; IQR: interquartile range; wt: wildtype.
1. wt/wt141 ± 10.4 (n = 713)17.5 ± 5.831.3 ± 5.028.7 ± 10.7 (n = 517)54 (29 - 92) (n = 710)
2. H63D/wt142 ± 11.2 (n = 248)17.6 ± 5.730.9 ± 4.429.4 ± 10.9 (n = 175)53 (28 - 86) (n = 247)
3. C282Y/wt143 ± 11.7 (n = 104)18.3 ± 7.629.2 ± 4.432.0 ± 13.2 (n = 79)43 (21 - 71) (n = 102)
4. H63D/H63D136 ± 10.6 (n = 14)19.2 ± 12.628.0 ± 3.734.9 ± 22.5 (n = 11)42 (31 - 94) (n = 14)
5. C282Y/H63D146 ± 9.7 (n = 17)19.3 ± 7.428.5 ± 2.934.4 ± 14.0 (n = 12)28 (23 - 111) (n = 17)
6. C282Y/C282Y144 ± 12.2 (n = 4)272359a (n = 1)57 (28 - 95) (n = 4). a14, 41, 73, and 116 µg/L
Kruskal-Wallis test, P-value0.20.50.00020.0500.3
One-way ANOVA F-test, P-value0.10.4< 0.0010.0030.2


Table 7. Differences Between Iron Status Markers in Women, Non-Blood Donors, According to HFE Genotypes
 
HFE genotypeS-ironS-transferrinS-transferrin saturationS-ferritin
P-valuesP-valuesP-valuesP-values
Values used for calculation of significances are shown in Table 6. Student’s t-test for unpaired values, two-tailed probability. Significance level with Bonferroni’s correction P < 0.005. wt: wildtype.
wt/wt vs. H63D/wt0.80.30.50.8
wt/wt vs. C282Y/wt0.30.00040.0150.015
wt/wt vs. C282Y/H63D0.30.0540.070.5
wt/wt vs. H63D/H63D0.40.030.070.4
wt/wt vs. C282Y/C282Y0.9
H63D/wt vs. C282Y/wt0.40.00500.10.041
C282Y/wt vs. C282Y/H63D0.70.60.60.7
C282Y/H63D vs. H63D/H63D0.90.70.90.3
H63D/H63D vs. C282Y/C282Y0.6