Figures
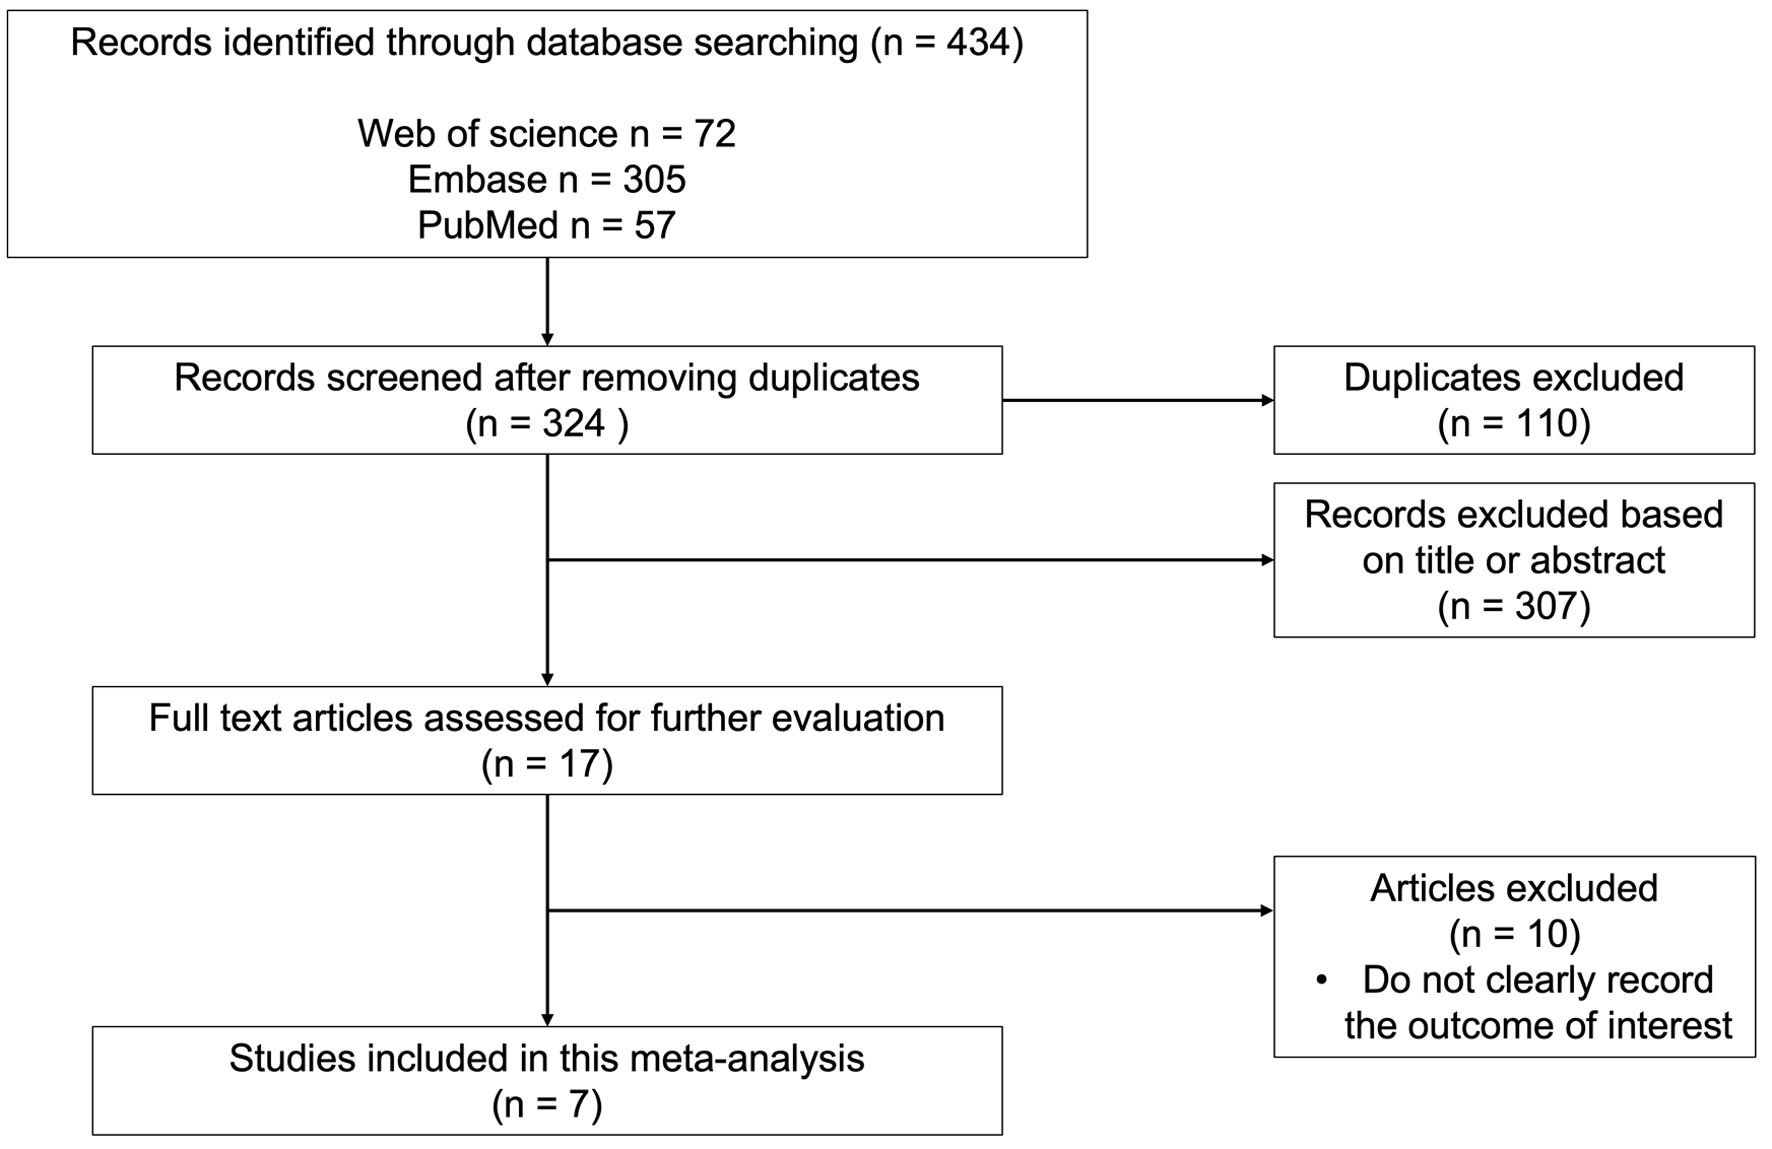
↓ Figure 1. Detailed flow diagram of study selection process.
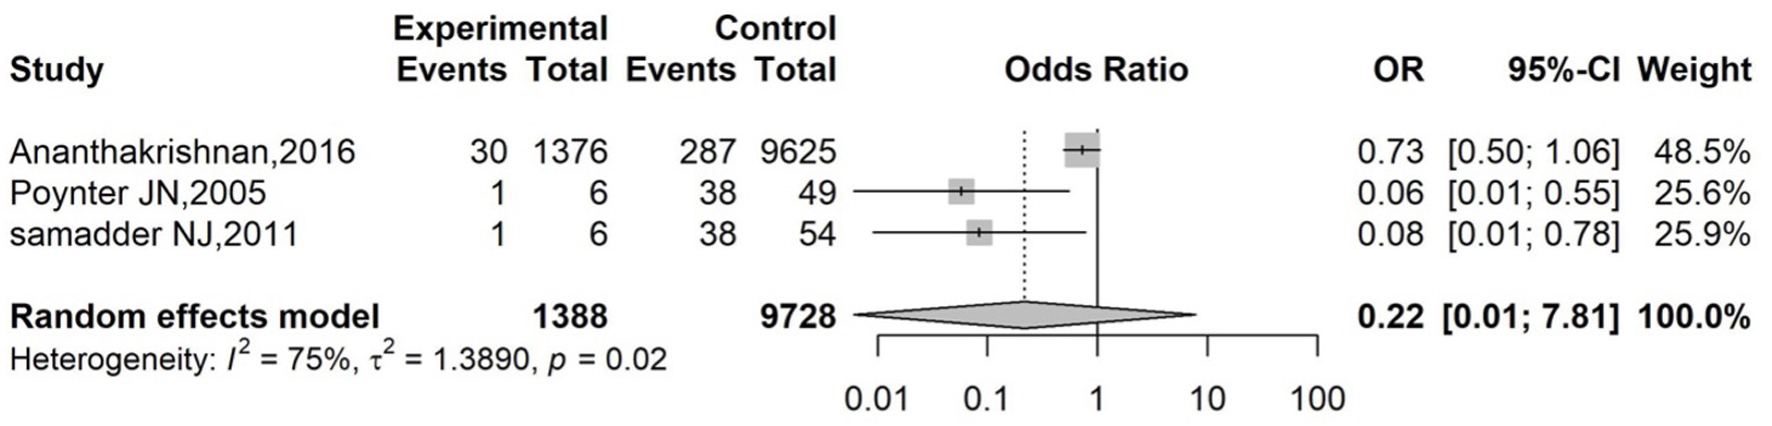
↓ Figure 2. Forest plot of overall effect for OR. Forest plot of pooled ORs and 95% CIs from three studies evaluating the association between statin use and colorectal cancer risk in IBD patients. The diamond represents the overall random-effects model (OR: 0.22; 95% CI: 0.01 - 7.81; P = 0.02; I2 = 75%). CI: confidence interval; IBD: inflammatory bowel disease; OR: odds ratio.
↓ Figure 3. Funnel plot to evaluate for publication bias (odds ratio). Funnel plot assessing publication bias among studies included in the odds ratio analysis. Each dot represents an individual study.

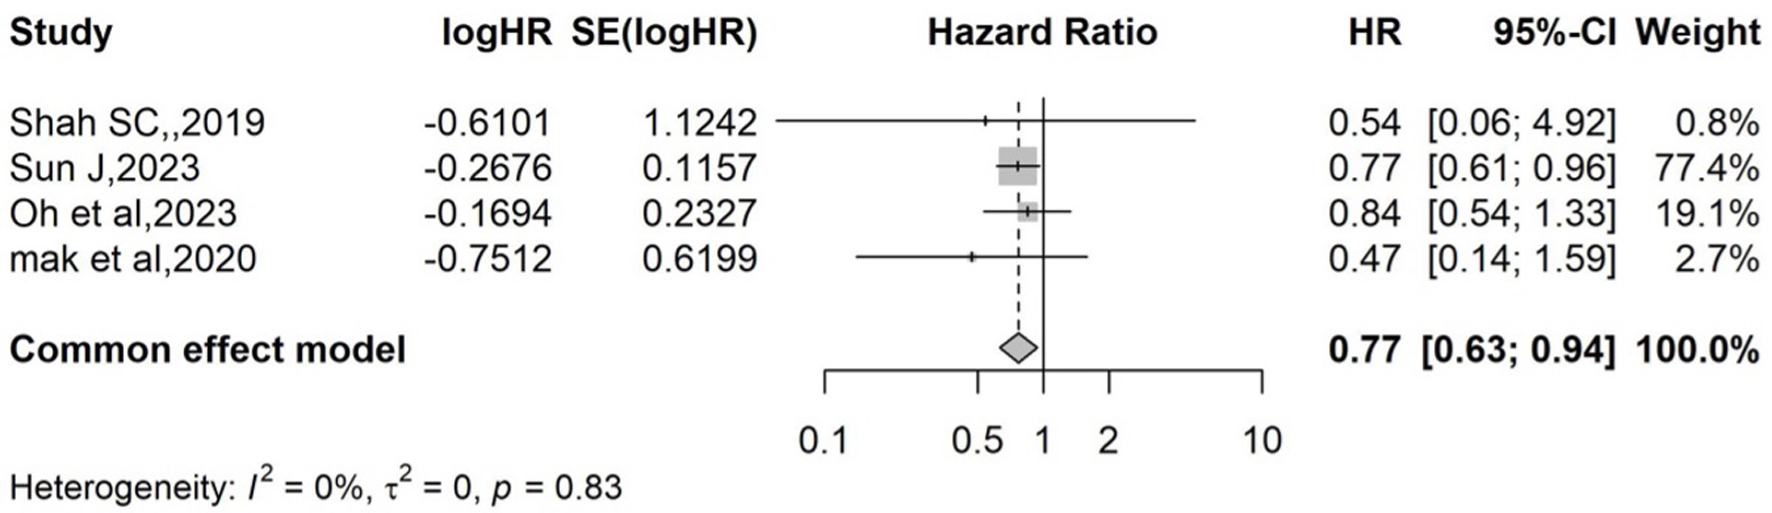
↓ Figure 4. Forest plot of overall effect for HR. Forest plot displaying individual and pooled HRs with 95% CIs for the association between statin use and colorectal cancer risk in IBD patients. The pooled effect size, based on the common-effect model (P = 0.78 and I2 = 0%), is HR = 0.77 (95% CI: 0.63 - 0.94). CI: confidence interval; HR: hazard ratio; IBD: inflammatory bowel disease.
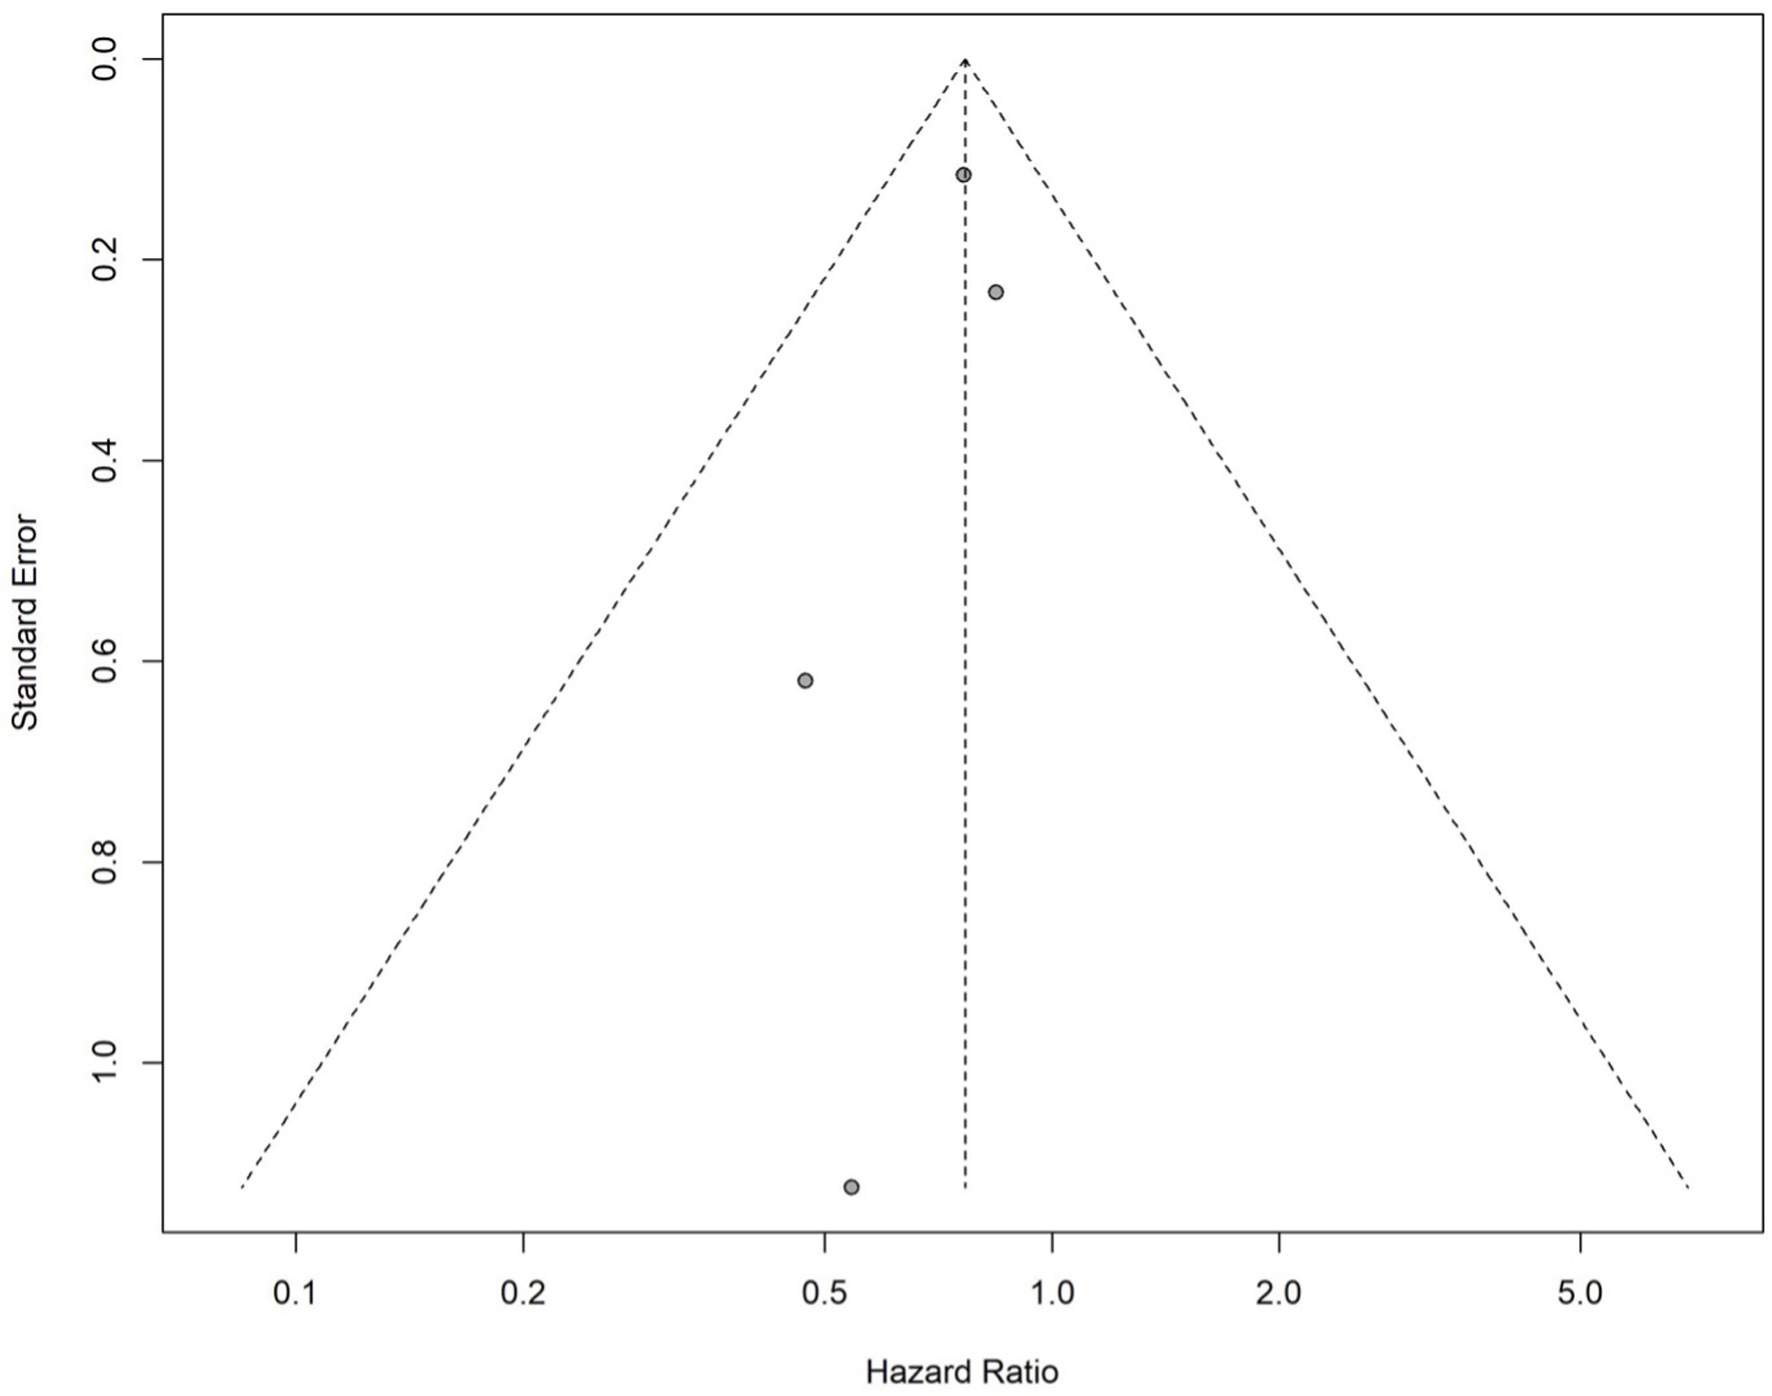
↓ Figure 5. Funnel plot to evaluate for publication bias (hazard ratio). Funnel plot assessing publication bias in studies reporting hazard ratios for colorectal cancer risk in inflammatory bowel disease patients on statins. Each dot represents a study.
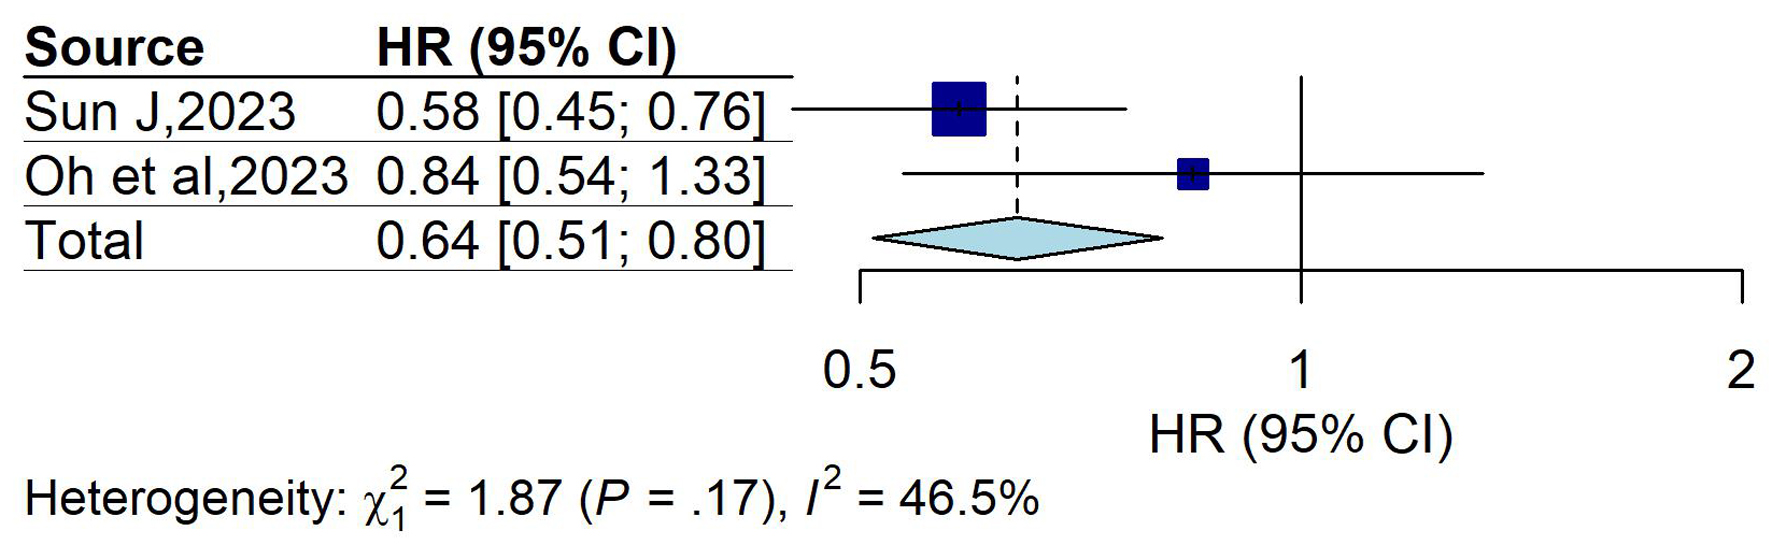
↓ Figure 6. Forest plot of overall effect (HR) in ulcerative colitis group. Forest plot showing pooled HRs with 95% CIs for the association between statin use and colorectal cancer risk in patients with ulcerative colitis. The overall HR was 0.64 (95% CI: 0.51 - 0.80), suggesting a protective effect. Moderate heterogeneity was observed (I2 = 46.5%; P = 0.17). CI: confidence interval; HR: hazard ratio.
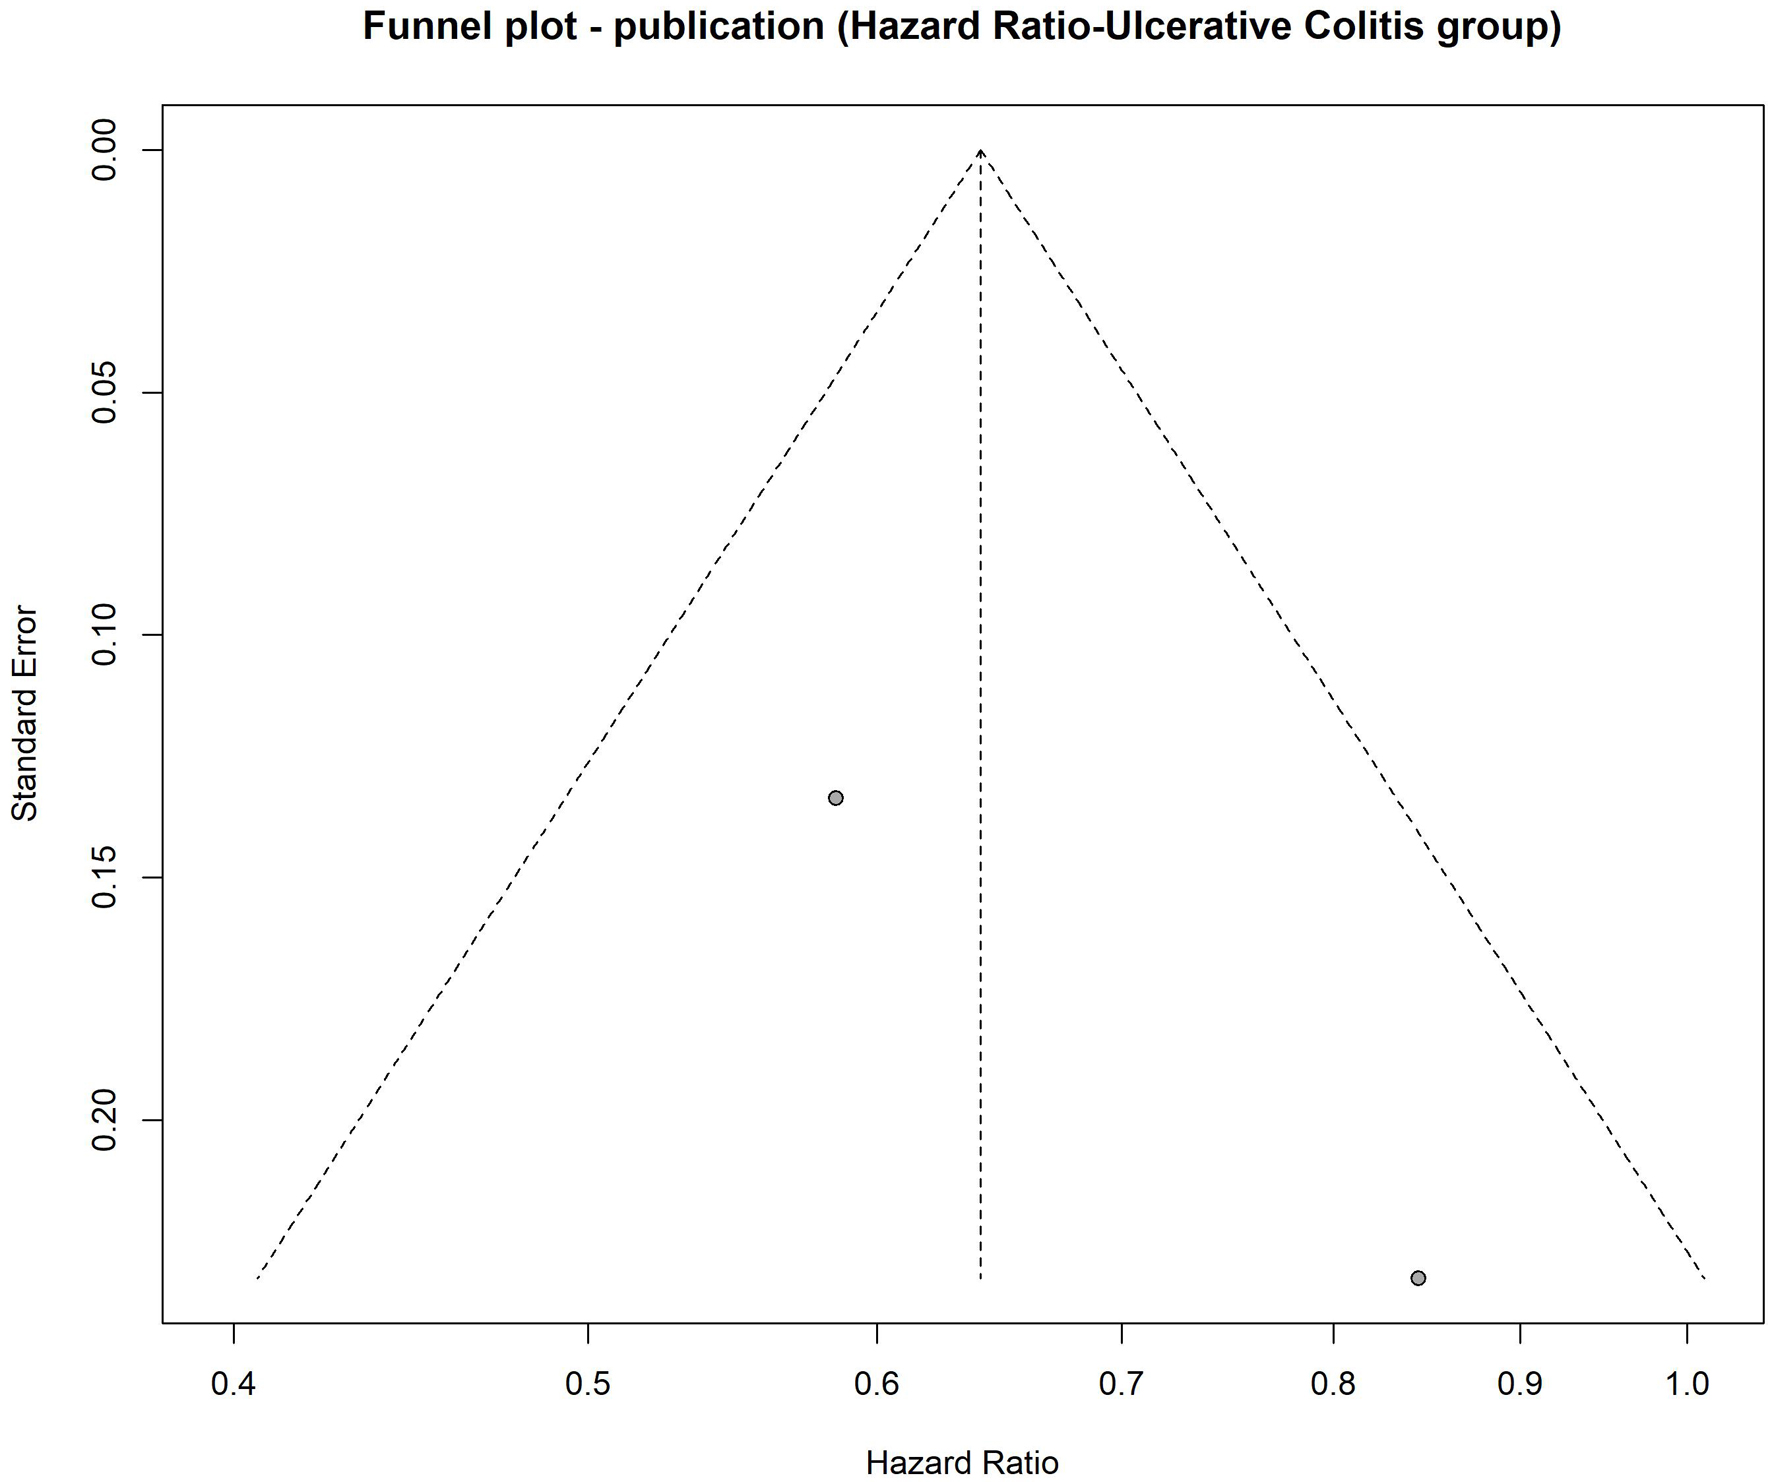
↓ Figure 7. Funnel plot to evaluate publication bias for hazard ratio in ulcerative colitis group. Funnel plot assessing publication bias among studies evaluating the association between statin use and colorectal cancer risk in ulcerative colitis patients.
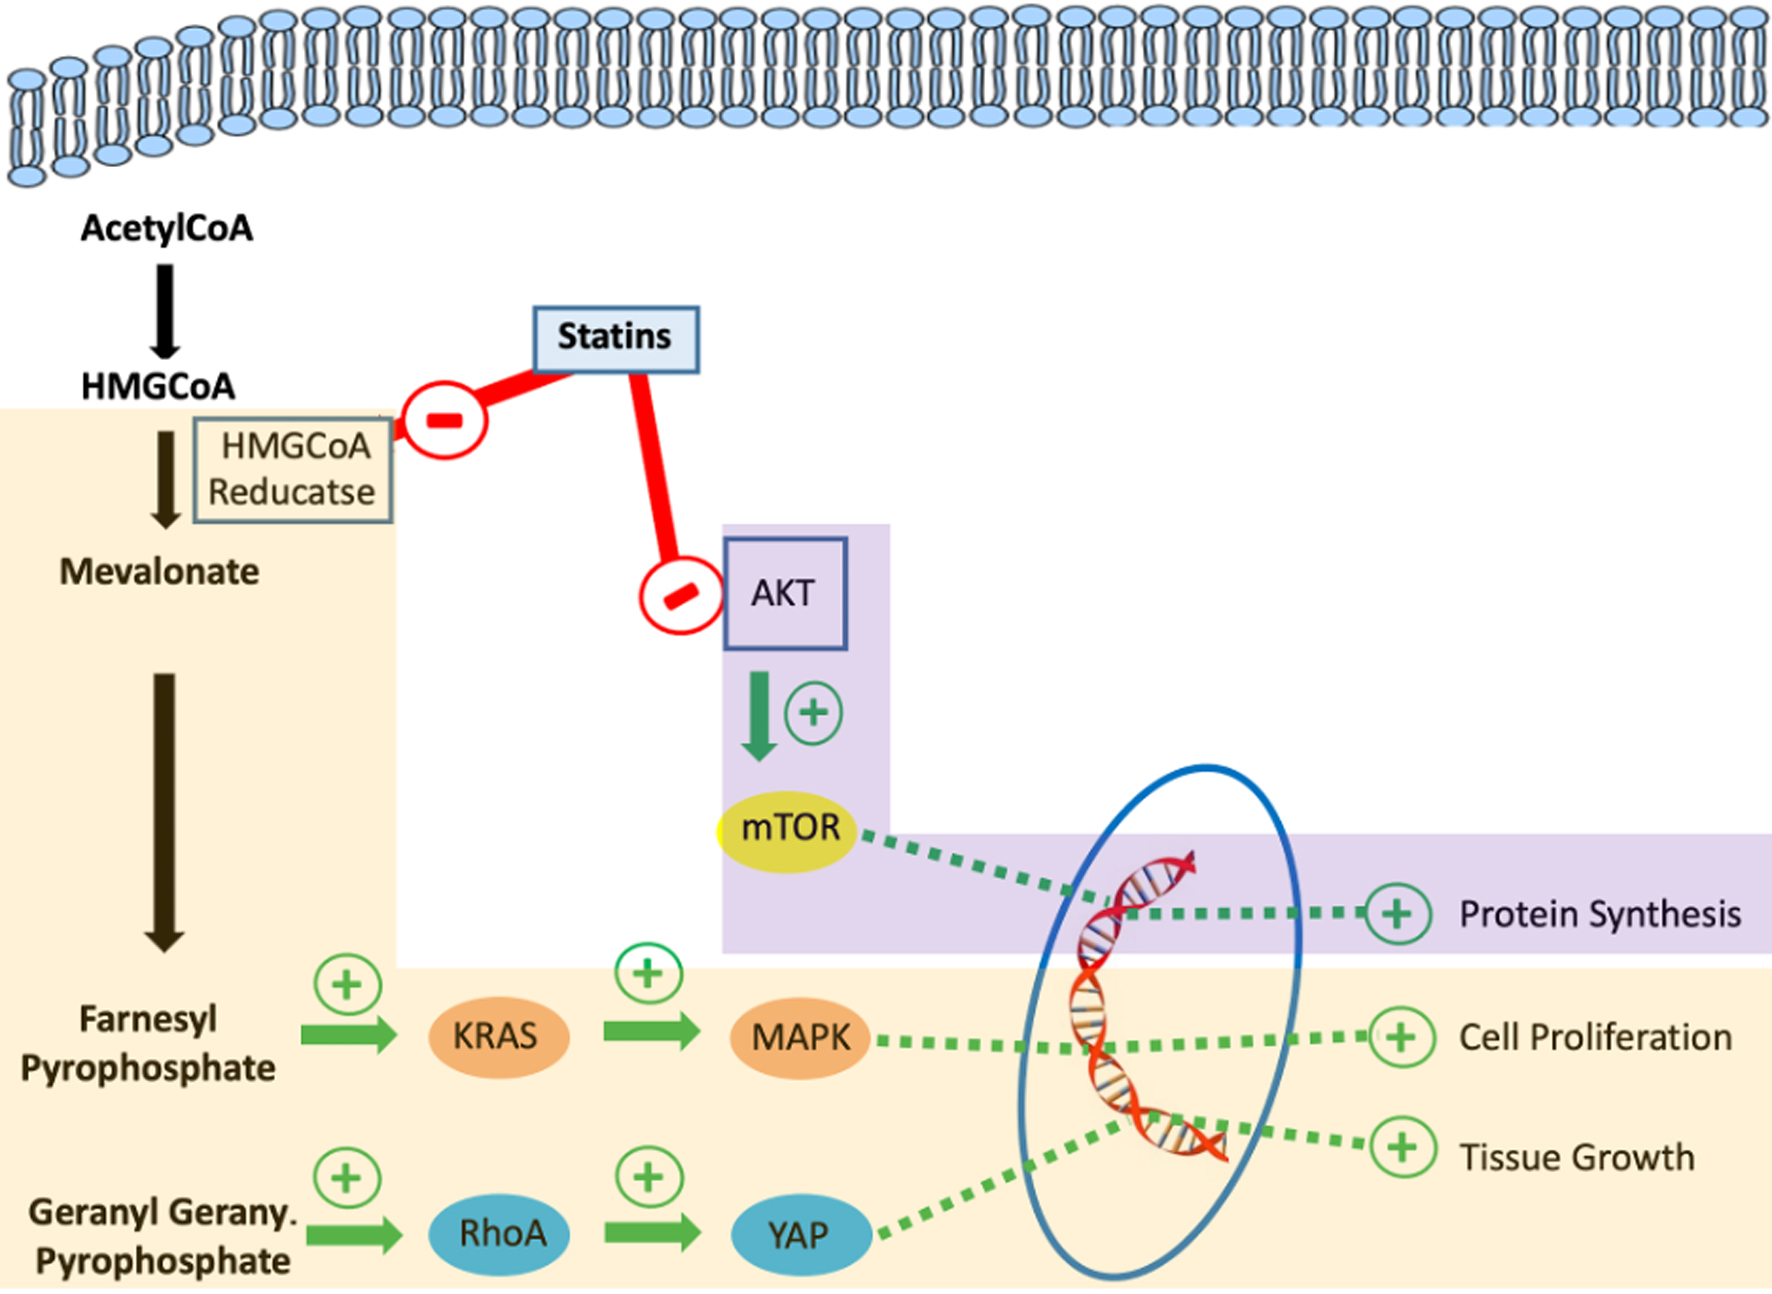
↓ Figure 8. Suggested cellular mechanisms of action through which statins reduce the risk of cancer development.
Table
↓ Table 1. Baseline Characteristics of Included Studies Investigating CRC Development in Patients Using Statins
| Author | Year | Country | Study design | OR/HR | Number of patients in statin group | Number of patients with CRC in statin group | Number of patients in non-statin group | Number of patients with CRC in non-statin group |
|---|
| CRC: colorectal cancer; HR: hazard ratio; OR: odds ratio. |
| Poynter et al [12] | 2005 | Israel | Retrospective | OR | 6 | 1 | 49 | 38 |
| Samadder et al [11] | 2011 | Israel | Retrospective | OR | 6 | 1 | 54 | 38 |
| Ananthakrishnan et al [13] | 2016 | USA | Retrospective | OR | 1,376 | 30 | 9,625 | 287 |
| Shah et al [14] | 2019 | USA | Retrospective | HR | 57 | 1 | 585 | 5 |
| Mak et al [15] | 2020 | China | Retrospective | HR | 222 | 3 | 1,881 | 45 |
| Sun et al [16] | 2023 | Sweden | Retrospective | HR | 5,273 | 70 | 5,273 | 90 |
| Oh et al [10] | 2023 | South Kora | Retrospective | HR | 7,435 | 26 | 27,754 | 96 |