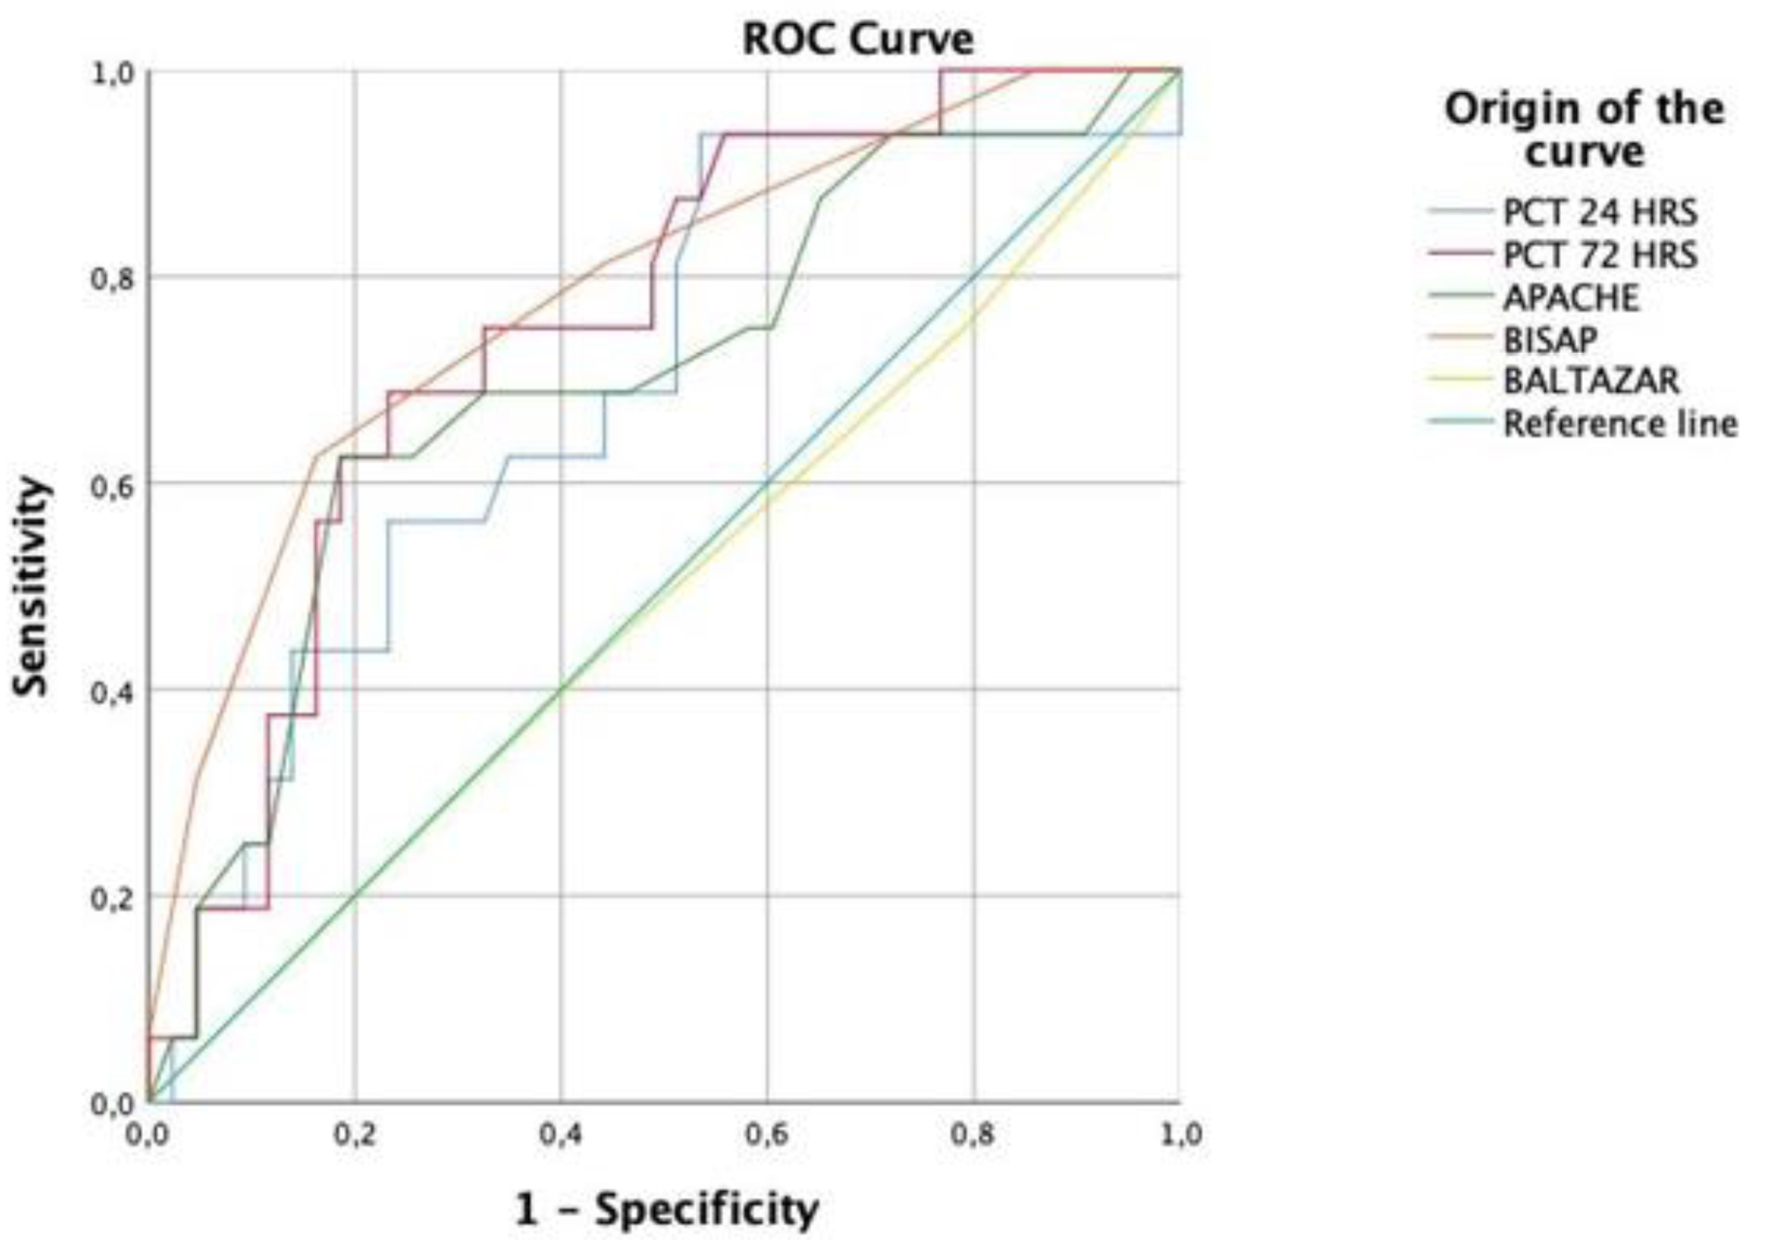
↓ Figure 1. PCT and scales of ROC curve. PCT: procalcitonin; ROC: receiver operating characteristic.
| Gastroenterology Research, ISSN 1918-2805 print, 1918-2813 online, Open Access |
| Article copyright, the authors; Journal compilation copyright, Gastroenterol Res and Elmer Press Inc |
| Journal website https://gr.elmerpub.com |
Original Article
Volume 18, Number 2, April 2025, pages 56-62
Procalcitonin as a Predictor of Mortality in Patients With Severe Acute Pancreatitis
Figure
Tables
| Total, n (%) | Survivors, n (%) | Non-survivors, n (%) | P value | |
|---|---|---|---|---|
| aChi-square test. bStudent’s t-test. APACHE: Acute Physiology and Chronic Health Evaluation; BISAP: Bedside Index for Severity in Acute Pancreatitis; n: number. | ||||
| Number of patients | 59 | 43 (72.9) | 16 (27.1) | |
| Sex | 0.292a | |||
| Men | 34 (57.6) | 23 (53.5) | 11 (68.8) | |
| Women | 25 (42.4) | 20 (46.5) | 5 (31.2) | |
| Etiology | ||||
| Lithiasis | 28 (47.5) | 19 (44.1) | 9 (56.3) | 0.409a |
| Endoscopic retrograde cholangiopancreatography | 9 (15.3) | 6 (14) | 3 (18.8) | 0.649a |
| Idiopathic | 7 (11.9) | 6 (14) | 1 (6.3) | 0.416a |
| Alcohol | 6 (10.2) | 5 (11.6) | 1 (6.3) | 0.543a |
| Drugs | 5 (8.5) | 4 (9.3) | 1 (6.3) | 0.708a |
| Hypertriglyceridemia | 4 (6.8) | 3 (7) | 1 (6.3) | 0.921a |
| Balthazar | ||||
| B | 3 (5.1) | 2 (4.7) | 1 (6.3) | 0.804a |
| C | 10 (16.9) | 7 (16.3) | 3 (18.8) | 0.822a |
| D | 20 (33.9) | 15 (34.9) | 5 (31.2) | 0.793a |
| E | 26 (44.1) | 19 (44.1) | 7 (43.8) | 0.976a |
| BISAP | 1.86 ± 1.22 | 1.51 ± 1.03 | 2.81 ± 1.22 | < 0.001b |
| APACHE II | 13.40 ± 6.42 | 12.23 ± 6.06 | 16.56 ± 6.48 | 0.020b |
| Hospitalization time | Mean ± SD | Median (IQR) | Mean rank | z | P value |
|---|---|---|---|---|---|
| aMann-Whitney U test. IQR: interquartile range; n: number; PCT: procalcitonin; SD: standard deviation. | |||||
| 24 h | |||||
| Survivors (n = 43) | 3.72 ± 8.22 | 0.79 (0.25 - 1.79) | 26.93 | -2.251 | 0.024a |
| Non-survivors (n = 16) | 6.76 ± 7.66 | 3.12 (0.76 - 12.16) | 38.25 | ||
| 72 h | |||||
| Survivors (n = 43) | 3.97 ± 9.48 | 0.82 (0.26 - 1.84) | 25.98 | -2.952 | 0.003a |
| Non-survivors (n = 16) | 8.60 ± 13.83 | 5.10 (0.94 - 9.16) | 40.81 | ||
| Mortality | PCT at 24 h | PCT at 72 h |
|---|---|---|
| aSpearman’s correlation. PCT: procalcitonin; n: number. | ||
| Rho | 0.346 | 0.428 |
| Pa | 0.006a | 0.005a |
| N | 59 | 59 |
| Scales | AUC ROC | P value | 95% CI | Cut-off point | Sensitivity | Specificity | PPV | NPV |
|---|---|---|---|---|---|---|---|---|
| *Significant. APACHE: Acute Physiology and Chronic Health Evaluation; AUC: area under the curve; BISAP: Bedside Index for Severity in Acute Pancreatitis; CI: confidence interval; NPV: negative predictive value; PPV: positive predictive value; ROC: receiver operating characteristic. | ||||||||
| APACHE II | 0.702 ± 0.07 | 0.018* | 0.54 - 0.85 | 14.5 | 68% | 67% | 0.44 | 0.85 |
| BISAP | 0.783 ± 0.06 | 0.001* | 0.64 - 0.91 | 1.5 | 81% | 55% | 0.40 | 0.88 |
| Balthazar | 0.486 ± 0.08 | 0.871 | 0.31 - 0.65 | 3.5 | 43% | 55% | 0.26 | 0.72 |
| Hospitalization time | AUC ROC | P value | Cut-off point | Sensitivity | Specificity | PPV | NPV |
|---|---|---|---|---|---|---|---|
| AUC: area under the curve; NPV: negative predictive value; PCT: procalcitonin; PPV: positive predictive value; ROC: receiver operating characteristic. | |||||||
| 24 h | 0.692 ± 0.07 | 0.024 | 1.09 | 62% | 65% | 0.40 | 0.82 |
| 72 h | 0.751 ± 0.06 | 0.003 | 1.26 | 75% | 68% | 0.46 | 0.87 |