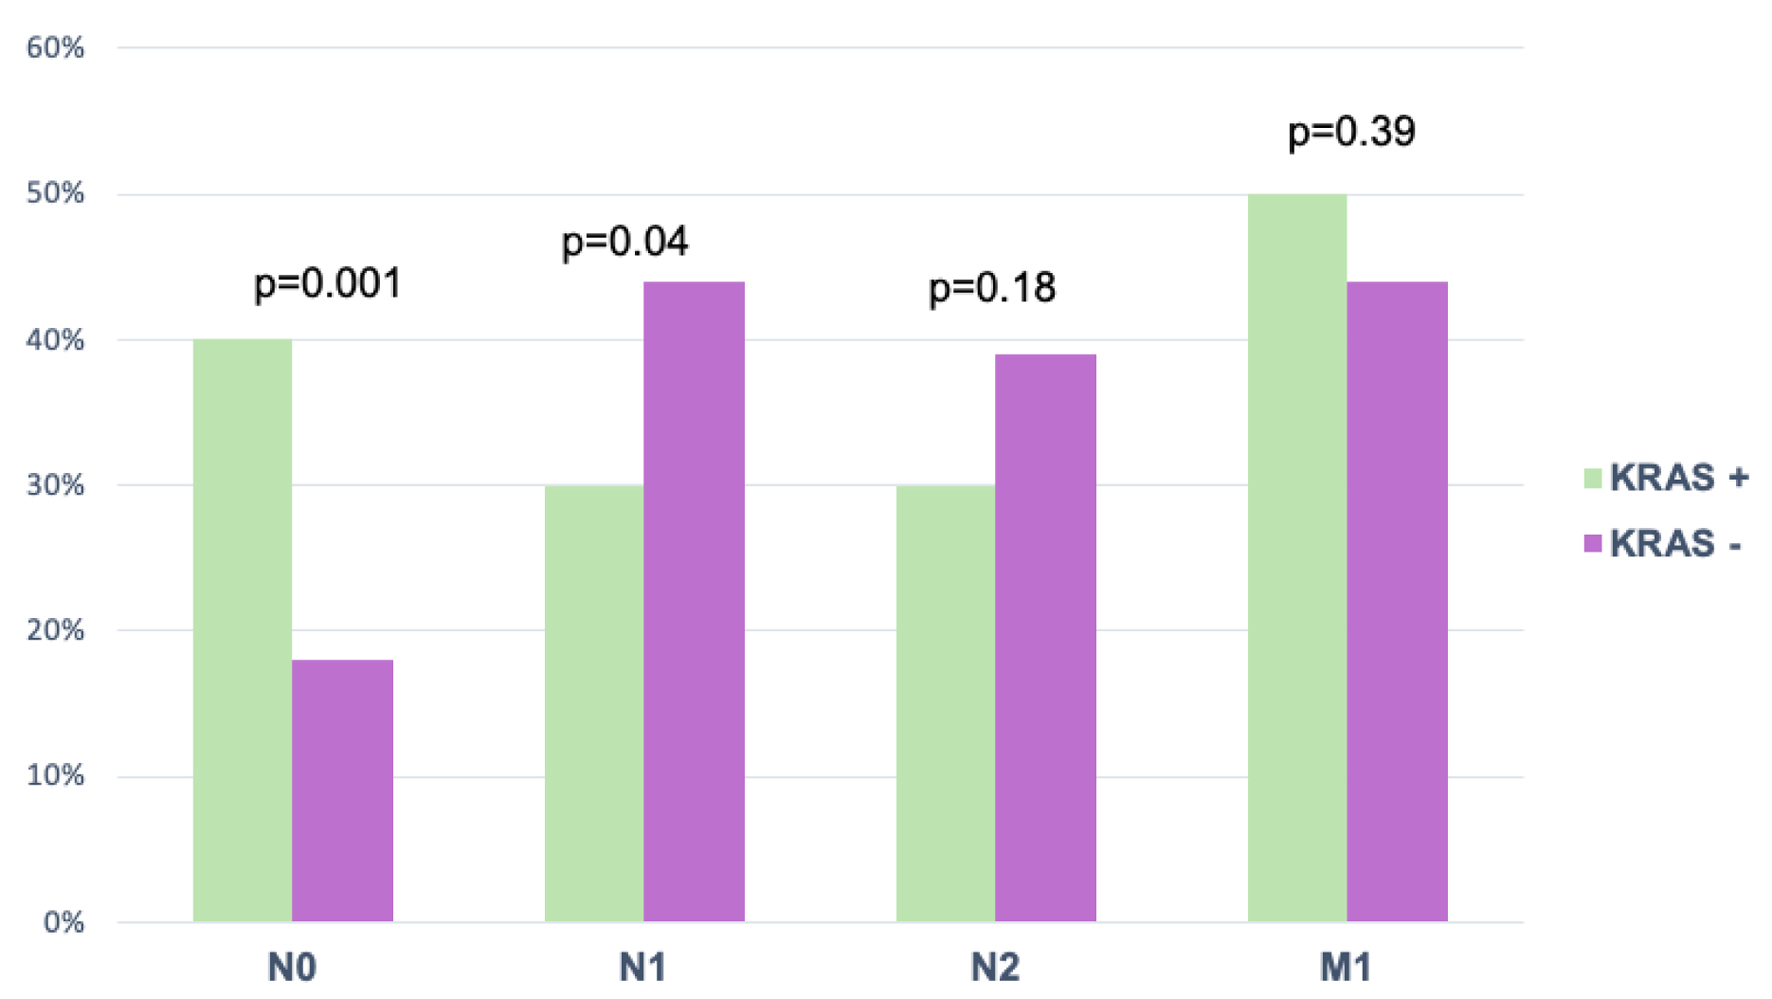
↓ Figure 1. Nodal involvement and metastasis by TNM with KRAS. Values were expressed as percentages. Chi-square test was used for comparison. KRAS: Kirsten rat sarcoma oncogene; TNM: tumor, node, metastasis.
| Gastroenterology Research, ISSN 1918-2805 print, 1918-2813 online, Open Access |
| Article copyright, the authors; Journal compilation copyright, Gastroenterol Res and Elmer Press Inc |
| Journal website https://gr.elmerpub.com |
Original Article
Volume 18, Number 4, August 2025, pages 175-181
Clinicopathological Features of KRAS-Mutated Colon Cancer: An Analytical Cross-Sectional Study
Figure
Tables
| Variable | KRAS+ (n = 18) | KRAS- (n = 33) | P value | OR | 95% CI |
|---|---|---|---|---|---|
| aChi-square test. bStudent t-test. cFisher exact test. CI: confidence interval; COPD: chronic obstructive pulmonary disease; KRAS: Kirsten rat sarcoma oncogene; OR: odds ratio; PCa: prostate cancer. | |||||
| Male, n (%) | 11 (61.1%) | 22 (66.7%) | 0.69a | 0.78 | 0.2 - 2.5 |
| Age, mean ± SD | 66.5 ± 10.9 | 58.3 ± 10.1 | 0.01b | ||
| ≥ 60 years | 16 (88.9%) | 18 (54.5%) | 0.01a | 6.6 | 1.3 - 33 |
| < 60 years | 2 (11.1%) | 15 (45.4%) | 0.01a | 0.15 | 0.03 - 0.7 |
| Comorbilities, n (%) | 18 (100%) | 15 (45.4%) | 0.001a | 0 | 0 |
| heart disease, n (%) | 9 (50%) | 9 (27.2%) | 0.132c | 2.6 | 0.8 - 8.8 |
| Diabetes, n (%) | 9 (50%) | 5 (15.1%) | 0.008a | 5.6 | 1.4 - 21 |
| Others (PCa, thyroid cancer, COPD, bladder cancer), n (%) | 5 (27.7%) | 2 (6.0%) | 0.044c | 5.9 | 1.0 - 34.7 |
| Anatomical region | |||||
| Sigmoid | 11 (61.1%) | 10 (30.3%) | 0.03 | 3.6 | 1.0 - 12 |
| Rectum | 3 (16.6%) | 9 (27.2%) | 0.393 | 0.53 | 0.1 - 2.2 |
| Ascending colon | 2 (11.1%) | 7 (21.2%) | 0.366 | 0.46 | 0.08 - 2.5 |
| Descending colon | 1 (5.6%) | 6 (18.2%) | 0.210 | 0.26 | 0.02 - 2.3 |
| Transverse colon | 1 (5.6%) | 1 (3%) | 0.657 | 1.88 | 0.1 - 32 |
| Variable | KRAS+ (n = 18) | KRAS- (n = 33) | P valuea | OR | 95% CI |
|---|---|---|---|---|---|
| aChi-square test. CI: confidence interval; KRAS: Kirsten rat sarcoma oncogene; OR: odds ratio. | |||||
| Histological grading | |||||
| Well-differentiated, n (%) | 2 (11.1%) | 4 (12.1%) | 0.91 | 0.90 | 0.14 - 5.5 |
| Moderately differentiated, n (%) | 14 (77.7%) | 25 (75.7%) | 0.87 | 1.12 | 0.28 - 4.3 |
| Poorly differentiated, n (%) | 2 (11.1%) | 4 (12.1%) | 0.91 | 0.90 | 0.14 - 5.5 |
| Histological type | |||||
| Tubular adenocarcinoma, n (%) | 16 (88.8%) | 29 (87.8%) | 0.91 | 1.10 | 0.18 - 6.7 |
| Mucinous adenocarcinoma, n (%) | 2 (11.1%) | 2 (6.0%) | 0.52 | 1.93 | 0.24 - 15 |
| Serrated Adenocarcinoma, n (%) | 0 (0%) | 2 (6.0%) | 0.28 | 0 | 0 |
| TNM stage | KRAS+ (n = 18) | KRAS- (n = 33) |
|---|---|---|
| KRAS: Kirsten rat sarcoma oncogene; TNM: tumor, node, metastasis. | ||
| I, n (%) | 0 (0%) | 0 (0%) |
| II, n (%) | 2 (11.1%) | 2 (6.0%) |
| IIa, n (%) | 0 (0%) | 0 (0%) |
| IIb, n (%) | 2 (11.1%) | 0 (0%) |
| IIc, n (%) | 0 (0%) | 2 (6.0%) |
| III, n (%) | 5 (27.7%) | 13 (39.3%) |
| IIIa, n (%) | 2 (11.1%) | 0 (0%) |
| IIIb, n (%) | 2 (11.1%) | 7 (21.2%) |
| IIIc, n (%) | 2 (11.1%) | 5 (15.5%) |
| IV, n (%) | 11 (61.1%) | 18 (54.5%) |
| IVa, n (%) | 2 (11.1%) | 4 (12.1%) |
| IVb, n (%) | 7 (38.8%) | 15 (45.4%) |
| IVc, n (%) | 2 (11.1%) | 0 (0%) |
| BRAF mutation | KRAS+ (n = 18) | KRAS- (n = 33) | P value | OR | 95% CI |
|---|---|---|---|---|---|
| aChi-square test. bStudent’s t-test. BRAF: B-Raf proto-oncogene; CEA: carcinoembryonic antigen; CI: confidence interval; KRAS: Kirsten rat sarcoma oncogene; OR: odds ratio. | |||||
| Present, n (%) | 11 (61.1%) | 5 (15.1%) | 0.001a | 8.8 | 2.2 - 33 |
| Absent, n (%) | 7 (38.8%) | 28 (84.8%) | 0.056 | 3.5 | 0.9 - 13 |
| CEA, mean ± SD | 973.10 ± 162.53 | 132.15 ± 184.61 | 0.001b | ||