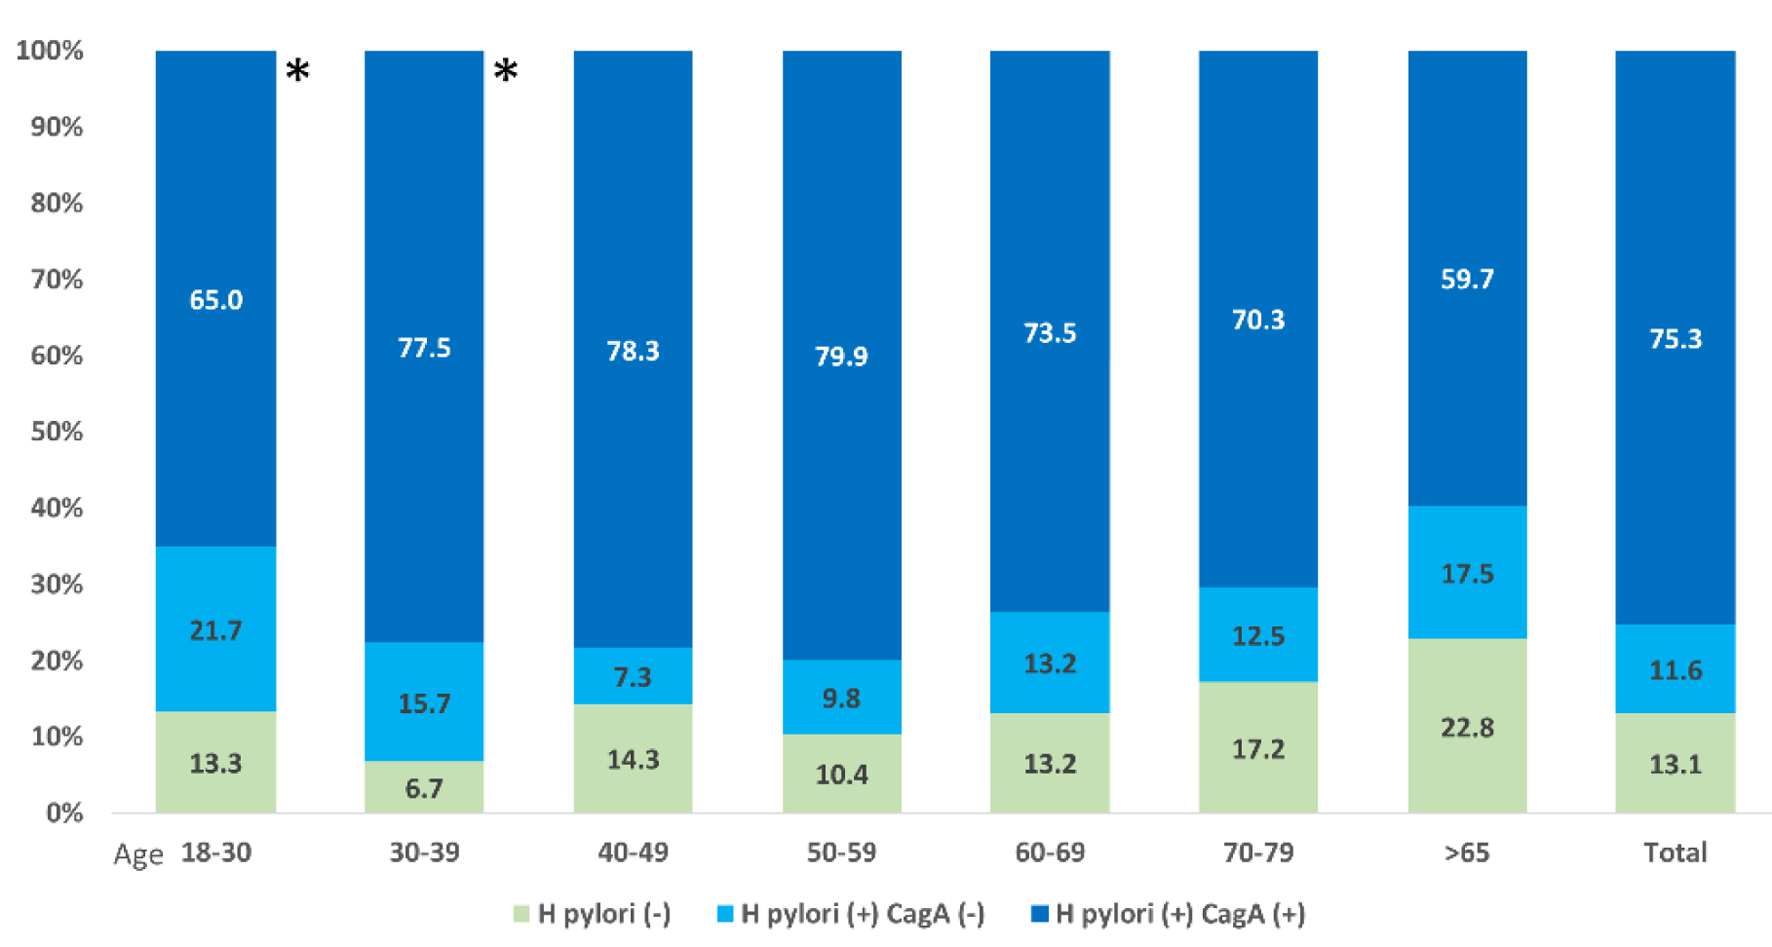
Gastroenterology Research, ISSN 1918-2805 print, 1918-2813 online, Open Access
Article copyright, the authors; Journal compilation copyright, Gastroenterol Res and Elmer Press Inc
Journal website https://gr.elmerpub.com

Original Article

Volume 18, Number 3, June 2025, pages 119-128


High Seroprevalence of Helicobacter pylori and CagA/VacA Virulence Factors in Northern Central America

Figures

Figure 1.
Figure 1. Sampling locations and participant recruitment across Northern Central America. This figure depicts the distribution and response rates of the subjects invited to participate in the study conducted in Northern Central America. In total, 1,143 participants were invited from various urban and rural centers within Guatemala and Honduras. The map highlights Guatemala with two urban centers and three rural centers, where 444 of the 461 subjects completed the serology tests. Similarly, in Honduras, all 699 invited subjects from three rural centers completed the tests. The shaded areas indicate the regions where the subjects were sampled, and the details provided within the insets specify the number of participants and completion rates of serological testing.
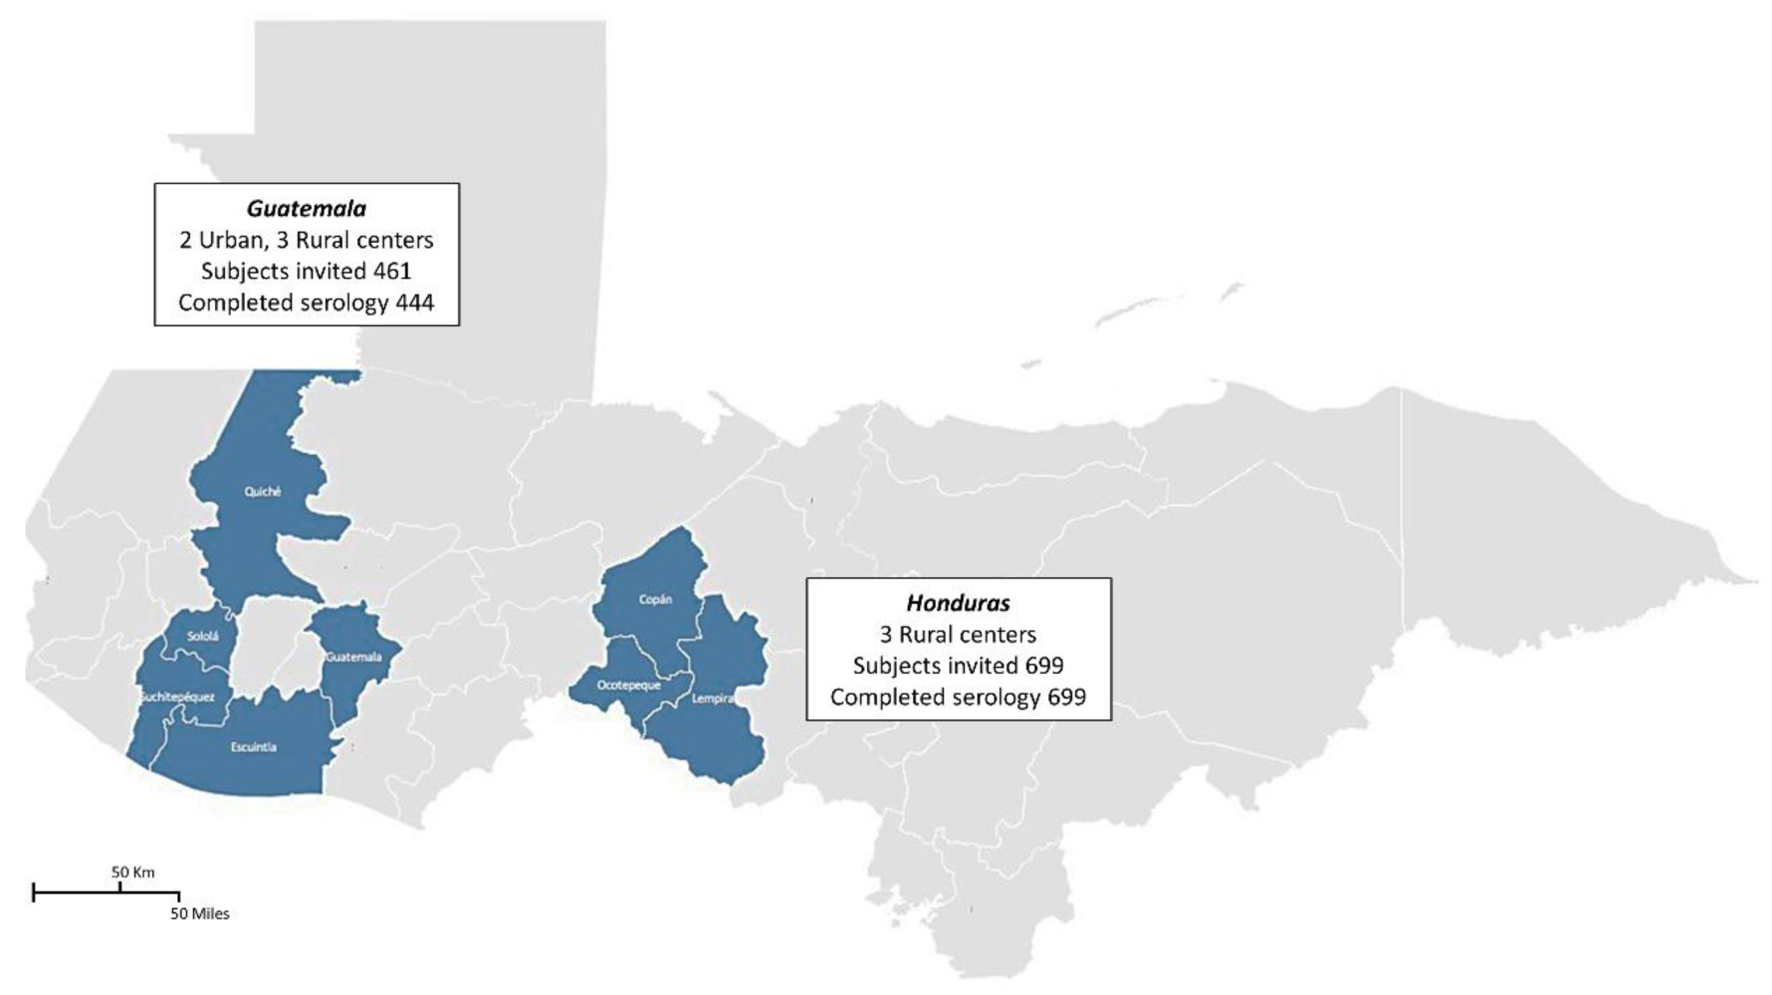
Figure 2.
Figure 2. Prevalence of H. pylori, CagA, and VacA seropositivity by country (N = 1,143). This figure presents the prevalence rates of H. pylori serostatus and associated virulence factors among the populations sampled in Honduras and Guatemala. The bar chart compares the positive rates of H. pylori serostatus, active infection, and the presence of CagA and VacA virulence factors between the two countries as well as the total combined prevalence.
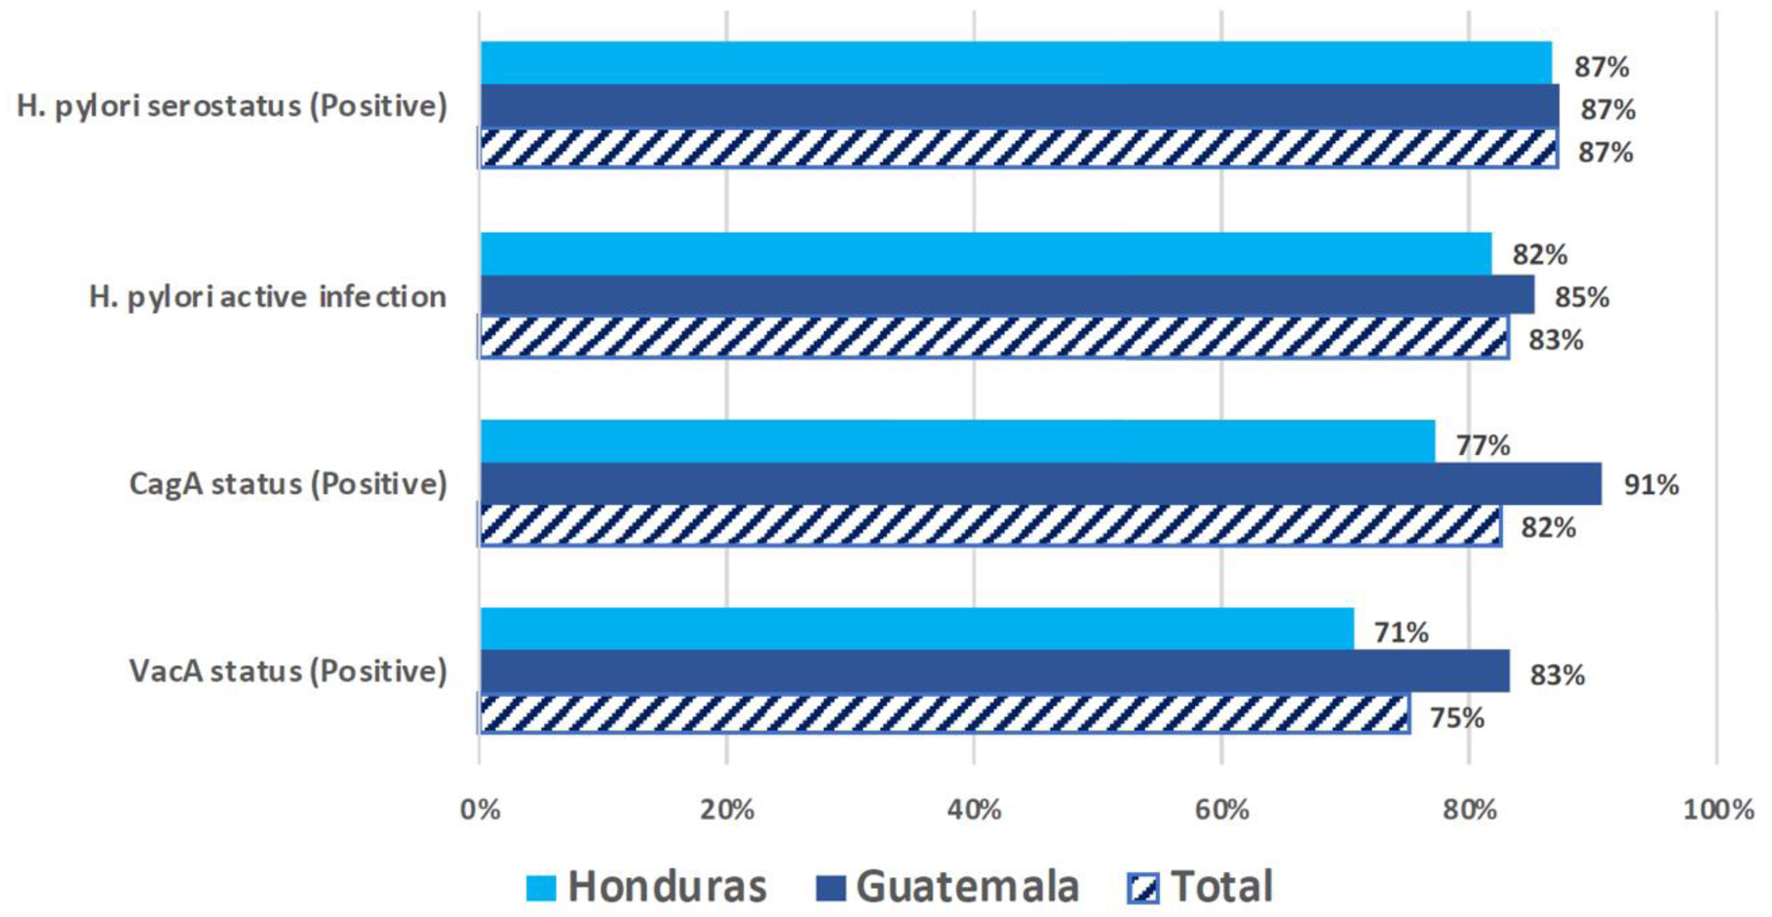
Figure 3.
Figure 3. H. pylori and CagA seropositivity by age groups (N = 1,143). This figure illustrates the distribution of H. pylori and CagA seropositivity across different age groups among the 1,143 individuals sampled. The stacked bar chart shows the percentages of participants who were H. pylori-positive with and without CagA positivity (shown in darker and lighter shades of blue, respectively) and those who were H. pylori-negative (shown in green). Age groups were segmented as 18 - 30, 30 - 39, 40 - 49, 50 - 59, 60 - 69, and over 65 years (*Honduras participants only).

Tables

Table 1. Socioeconomic, Clinical, and Related Characteristics of Study Participants
 
GuatemalaHondurasTotal
aIn Guatemala, all these individuals were 40 - 45 years old. bTobacco use was defined as an adult who has smoked at least 100 cigarettes in his or her lifetime. cAntibiotic exposure was defined as any antibiotics for any reason in the last 6 months. dAlcohol consumption was defined as at least 12 drinks in any one year in lifetime. BMI: body mass index; CagA: cytotoxin-associated gene A; IQR: interquartile range; mamsl: meters above mean sea level; SD: standard deviation; VacA: vacuolating cytotoxin A.
N4446991,143
Age, mean (SD)55.4 (10.7)53.4 (16.5)54.2 (14.5)
Age categories
  18 - 4590 (20.3%)a219 (31.3%)309 (27.0%)
  45 - 54138 (31.1%)159 (22.7%)297 (26.0%)
  55 - 64122 (27.5%)147 (21.0%)269 (23.5%)
  > 6594 (21.2%)174 (24.9%)268 (23.4%)
Sex
  Female255 (57.4%)360 (51.5%)615 (53.8%)
  Male189 (42.6%)339 (48.5%)528 (46.2%)
Rural setting272 (61.3%)411 (58.8%)683 (59.8%)
Altitude (mamsl), mean (SD)1,250.8 (644.6)983.4 (209.2)1,087.9 (453.7)
Altitude > 1,000 mamsl272 (61.3%)369 (53.3%)641 (56.4%)
Occupation
  Professional9 (2.0%)29 (4.1%)38 (3.3%)
  Technician2 (0.5%)37 (5.3%)39 (3.4%)
  Artisan or vendor182 (41.0%)57 (8.2%)239 (20.9%)
  Construction21 (4.7%)23 (3.3%)44 (3.8%)
  Agriculture54 (12.2%)167 (23.9%)221 (19.3%)
  Housewife144 (32.4%)313 (44.8%)457 (40.0%)
  Other or not available32 (7.2%)73 (10.4%)105 (9.2%)
BMI, median (IQR)27.4 (23.9 - 30.7)24.8 (21.9 - 28.7)25.7 (22.7 - 29.7)
BMI categories
  Underweight (BMI < 18.5)5 (1.1%)31 (4.5%)36 (3.2%)
  Normal (18.5 - 24.9)148 (33.6%)323 (47.3%)471 (41.9%)
  Overweight (25 - 29.9)155 (35.2%)197 (28.8%)352 (31.3%)
  Obese (> 30.0)132 (30.0%)132 (19.3%)264 (23.5%)
Current tobacco smokerb196 (44.1%)114 (16.3%)310 (27.1%)
Recent use of antibioticsc55 (12.4%)23 (3.3%)78 (6.8%)
Refrigerator200 (45.0%)408 (58.4%)608 (53.2%)
Alcohol consumptiond321 (72.3%)167 (23.9%)488 (42.7%)
Electric or gas stove265 (59.7%)122 (17.5%)387 (33.9%)
H. pylori serostatus (positive)387 (87.2%)606 (86.7%)993 (86.9%)
H. pylori active infection378 (85.1%)571 (81.7%)949 (83.0%)
CagA status (positive)402 (90.7%)539 (77.1%)941 (82.4%)
VacA status (positive)368 (83.1%)493 (70.5%)861 (75.4%)
CagA and VacA positive397 (89.4%)553 (79.1%)950 (83.1%)


Table 2. Socioeconomic and Clinical Characteristics Associated With CagA Positivity (N = 1,143)
 
H. pylori (-)H. pylori (+) CagA (-)H. pylori (+) CagA (+)P-value
*P < 0.05. BMI: body mass index; CagA: cytotoxin-associated gene A; mamsl: meters above the mean sea level; SD: standard deviation; VacA: vacuolating cytotoxin A.
N150132861
Age, mean (SD)56.6 (15.7)54.4 (16.8)53.7 (13.8)0.08
Age categories0.13
  18 - 4536 (24.0%)39 (29.5%)234 (27.2%)
  45 - 5434 (22.7%)28 (21.2%)235 (27.3%)
  55 - 6432 (21.3%)31 (23.5%)206 (23.9%)
  > 6548 (32.0%)34 (25.8%)186 (21.6%)
Sex0.61
  Female78 (52.0%)76 (57.6%)461 (53.5%)
  Male72 (48.0%)56 (42.4%)400 (46.5%)
Rural setting91 (60.7%)77 (58.3%)515 (59.8%)0.92
Altitude (mamsl), mean (SD)1,079.3 (425.0)1,031.2 (338.5)1,097.9 (473.1)0.29
Altitude > 1,000 mamsl81 (54.4%)82 (63.1%)478 (55.8%)0.25
BMI, median (IQR)25.5 (22.1 - 28.9)25.4 (22.3 - 30.3)25.7 (22.8 - 29.7)0.29
BMI categories0.054
  Underweight (BMI < 18.5)10 (6.8%)5 (3.8%)21 (2.5%)
  Normal (18.5 - 24.9)57 (38.8%)56 (43.1%)358 (42.3%)
  Overweight (25 - 29.9)54 (36.7%)36 (27.7%)262 (31.0%)
  Obese (> 30.0)26 (17.7%)33 (25.4%)205 (24.2%)
Current tobacco smoker37 (24.7%)25 (18.9%)248 (28.8%)0.046*
Recent use of antibiotics15 (10.0%)5 (3.8%)58 (6.7%)0.12
Refrigerator87 (58.0%)82 (62.1%)439 (51.0%)0.026*
Alcohol consumption66 (44.0%)46 (34.8%)376 (43.7%)0.15
Electric or gas stove63 (42.0%)34 (25.8%)290 (33.7%)0.016*
H. pylori active infection27 (18.0%)109 (82.6%)813 (94.4%)< 0.001*
VacA status (positive)36 (24.2%)53 (40.2%)772 (89.7%)< 0.001*


Table 3. Exploratory Univariate and Multivariate Analyses of Socioeconomic and Clinical Characteristics Associated With CagA Positivity (N = 1,143)
 
H. pylori (-) vs. CagA (+)CagA (-) vs. CagA (+)H. pylori (-) and CagA (-) vs. CagA (+)
Unadjusted ORAdjusted ORUnadjusted ORAdjusted ORUnadjusted ORAdjusted OR
OR (95% CI)P-valueOR (95% CI)P-valueOR (95% CI)P-valueOR (95% CI)P-valueOR (95% CI)P-valueOR (95% CI)P-value
Initial univariate analyses were performed with P < 0.1. Variables with a significant association were included in the multivariate analysis. *Variables with P < 0.05 in multivariate analysis. BMI: body mass index; CagA: cytotoxin-associated gene A; CI: confidence interval; mamsl: meters above mean sea level; OR: odds ratio; VacA: vacuolating cytotoxin A.
Age
  45 - 541.06 (0.64 - 1.76)0.811.12 (0.67 - 1.87)0.651.39 (0.93 - 2.34)0.211.16 (0.67 - 1.98)0.591.21 (0.82 - 1.78)0.321.19 (0.81 - 1.76)0.37
  55 - 640.99 (0.59 - 1.65)0.971.09 (0.64 - 1.84)0.751.1 (0.66 - 1.83)0.690.89 (0.51 - 1.53)0.681.04 (0.71 - 1.53)0.811.05 (0.71 - 1.55)0.80
  > 650.59 (0.37 - 0.96)0.0320.65 (0.39 - 1.05)0.0810.91 (0.55 - 1.50)0.720.79 (0.46 - 1.37)0.410.72 (0.50 - 1.05)0.0890.74 (0.51 - 1.08)0.13
Sex (male)0.94 (0.66 - 1.33)0.73--1.17 (0.81 - 1.70)0.390.96 (0.61 - 1.50)0.881.04 (0.79 - 1.36)0.75--
BMI
  Underweight0.33 (0.14 - 0.74)0.0080.37 (0.16 - 0.84)*0.018*0.65 (0.23 - 1.81)0.420.44 (0.22 - 0.88)0.0210.47 (0.23 - 0.96)*0.039*
  Overweight0.77 (0.51 - 1.15)0.210.80 (0.52 - 1.21)0.291.13 (0.72 - 1.78)0.57--0.91 (0.66 - 1.26)0.610.94 (0.68 - 1.31)0.75
  Obese1.25 (0.76 - 2.05)0.371.29 (0.78 - 2.17)0.320.97 (0.61 - 1.54)0.901.09 (0.76 - 1.56)0.611.11 (0.77 - 1.61)0.56
Altitude (> 1,000 mamsl)1.06 (0.75 - 1.50)0.32--0.73 (0.50 - 1.08)0.110.75 (0.51 - 1.10)0.150.89 (0.68 - 1.17)0.44
Current smoker1.24 (0.83 - 1.84)0.29--1.73 (1.09 - 2.74)0.0191.52 (0.91 - 2.54)0.101.43 (1.05 - 1.97)0.0261.44 (1.04 - 1.99)*0.028*
Recent use of antibiotics0.65 (0.36 - 1.18)0.16--1.83 (0.72 - 4.66)0.20--0.94 (0.55 - 1.60)0.84
Refrigerator0.75 (0.53 - 1.07)0.12--0.63 (0.43 - 0.92)0.0180.56 (0.38 - 0.83)*0.004*0.69 (0.52 - 0.91)0.0090.67 (0.50 - 0.89)*0.006*
Alcohol consumption0.99 (0.69 - 1.39)0.94--1.44 (0.98 - 2.12)0.06--1.17 (0.89 - 1.54)0.24--
Electric or gas stove0.70 (0.49 - 0.99)0.0490.65 (0.45 - 0.95)*0.027*1.46 (0.96 - 2.21)0.07--0.96 (0.72 - 1.28)0.83--
Urban Setting1.03 (0.72 - 1.47)0.84--0.94 (0.64 - 1.36)0.74--0.99 (0.75 - 1.30)0.94--