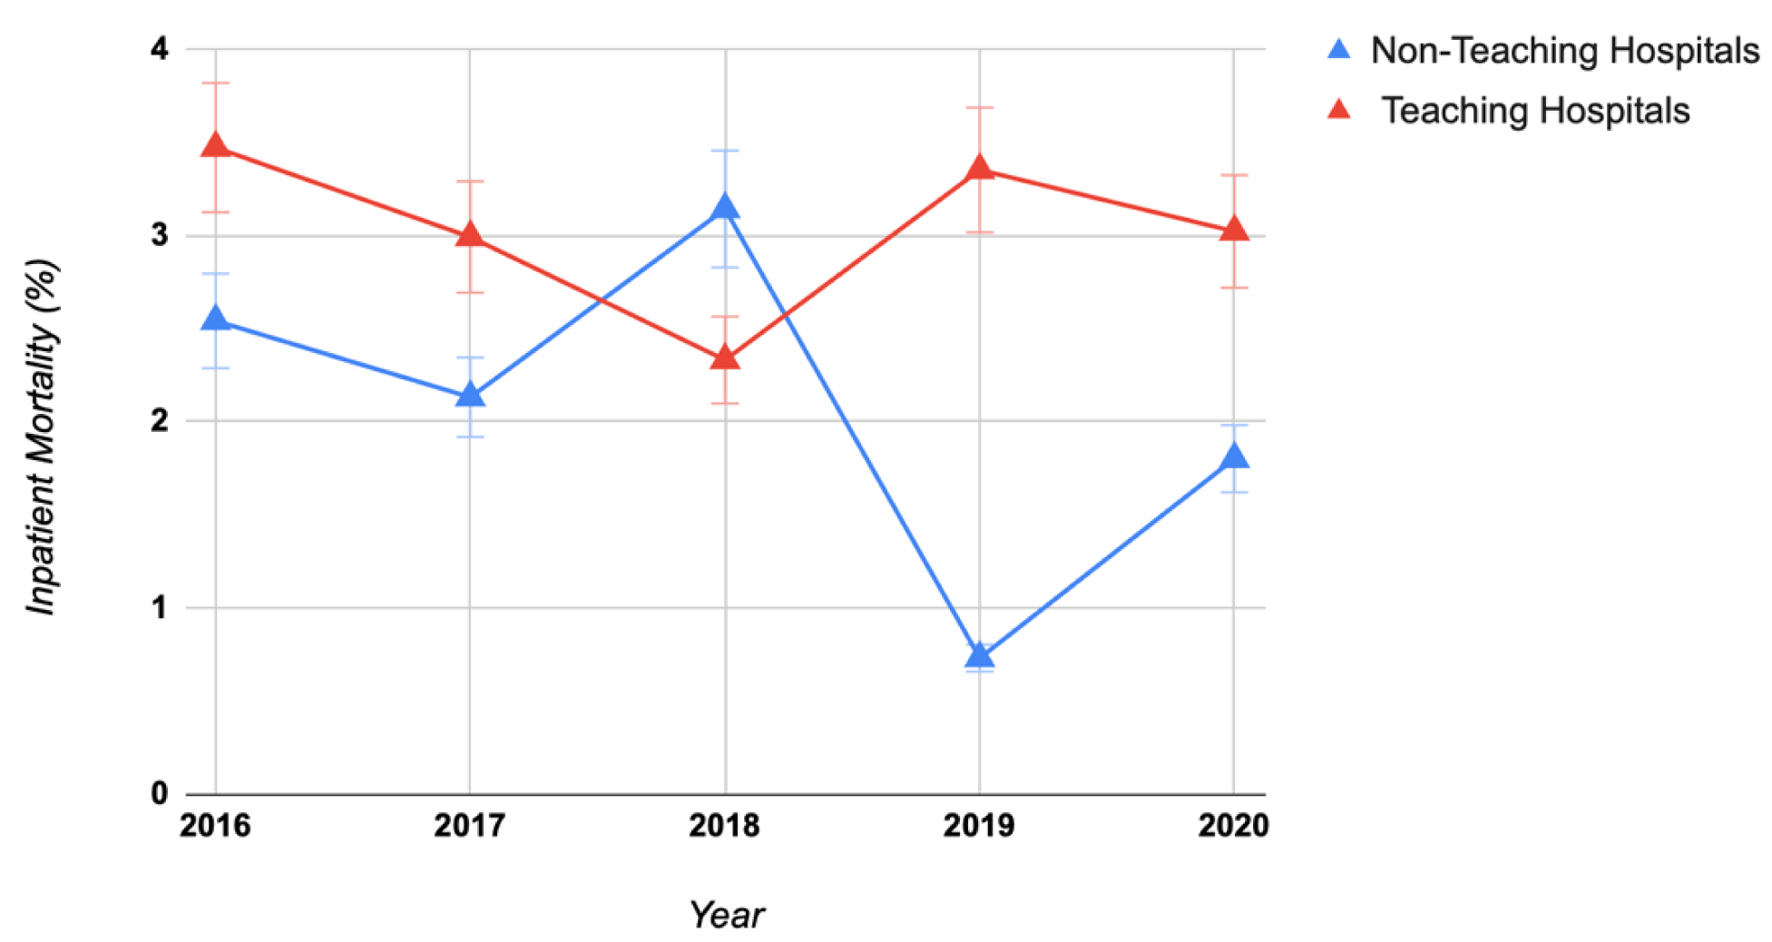
↓ Figure 1. Comparison of inpatient mortality in acute cholangitis in teaching vs. non-teaching hospitals. National Inpatient Sample database (2016 - 2020).
| Gastroenterology Research, ISSN 1918-2805 print, 1918-2813 online, Open Access |
| Article copyright, the authors; Journal compilation copyright, Gastroenterol Res and Elmer Press Inc |
| Journal website https://gr.elmerpub.com |
Original Article
Volume 18, Number 3, June 2025, pages 129-138
Impact of Hospital Teaching Status on Outcomes of Acute Cholangitis: A Propensity-Matched Analysis of Hospitalizations in the United States
Figures

Tables
| 2016 | 2017 | 2018 | 2019 | 2020 | |
|---|---|---|---|---|---|
| National Inpatient Sample database (2016 - 2020). CHF: congestive heart failure. | |||||
| Total, 6,765 | 1,575 | 1,410 | 1,435 | 1,230 | 1,110 |
| Female | 895 (56.83%) | 790 (56.03%) | 630 (43.75%) | 620 (50.41%) | 530 (47.75%) |
| Comorbidities | |||||
| Alcohol | 50 (3.17%) | 35 (2.48%) | 40 (2.78%) | 30 (2.44%) | 25 (2.25%) |
| CHF | 205 (13.02%) | 245 (17.38%) | 235 (16.32%) | 210 (17.07%) | 135 (12.16%) |
| Hypertension | 1,030 (65.40%) | 980 (69.50%) | 1,065 (73.96%) | 885 (71.95%) | 785 (70.72%) |
| Diabetes mellitus | 475 (30.16%) | 460 (32.62%) | 465 (32.29%) | 370 (30.08%) | 280 (25.23%) |
| Cirrhosis | 45 (2.86%) | 45 (3.19%) | 35 (2.43%) | 55 (4.47%) | 20 (1.80%) |
| Race | |||||
| White | 1160 (76.32%) | 1025 (75.65%) | 1100 (78.01%) | 920 (79.31%) | 860 (80.75%) |
| Black | 85 (5.59%) | 65 (4.80%) | 45 (3.19%) | 20 (1.72%) | 20 (1.88%) |
| Hispanic | 135 (8.88%) | 160 (11.81%) | 140 (9.93%) | 110 (9.48%) | 85 (7.98%) |
| Asian or Pacific Islander | 120 (7.89%) | 75 (5.54%) | 70 (4.96%) | 70 (6.03%) | 70 (6.57%) |
| Native American | 10 (0.66%) | 10 (0.74%) | 5 (0.35%) | 0 (0.0%) | 0 (0.0%) |
| Other | 10 (0.66%) | 20 (1.48%) | 50 (3.55%) | 40 (3.45%) | 30 (2.82%) |
| Age group | |||||
| 18 - 30 | 45 (2.86%) | 60 (4.26%) | 25 (1.74%) | 30 (2.44%) | 15 (1.40%) |
| 31 - 40 | 55 (3.49%) | 35 (2.48%) | 20 (1.39%) | 35 (2.85%) | 20 (1.86%) |
| 41 - 50 | 80 (5.08%) | 80 (5.67%) | 70 (4.86%) | 65 (5.28%) | 64 (6.05%) |
| 51 - 60 | 195 (12.38%) | 145 (10.28%) | 155 (10.76%) | 130 (10.57%) | 110 (10.23%) |
| 61 - 70 | 290 (18.41%) | 265 (18.79%) | 360 (25.00%) | 270 (21.96%) | 170 (15.81%) |
| 71 - 80 | 390 (24.76%) | 340 (24.11%) | 350 (24.31%) | 310 (25.20%) | 295 (27.44%) |
| > 80 | 520 (33.02%) | 485 (34.40%) | 460 (31.94%) | 390 (31.71%) | 400 (37.21%) |
| 2016 | 2017 | 2018 | 2019 | 2020 | |
|---|---|---|---|---|---|
| National Inpatient Sample database (2016 - 2020). CHF: congestive heart failure. | |||||
| Total, 23,535 | 3,895 | 4,515 | 4,945 | 5,220 | 4,960 |
| Female | 2,000 (51.35%) | 2,415 (53.49%) | 2,595 (52.48%) | 2,650 (50.77%) | 2,440 (49.19%) |
| Comorbidities | |||||
| Alcohol | 155 (3.98%) | 130 (2.88%) | 160 (3.24%) | 160 (3.07%) | 195 (3.93%) |
| CHF | 540 (13.86%) | 685 (15.17%) | 890 (18.0%) | 890 (17.05%) | 940 (18.95%) |
| Hypertension | 2,705 (69.45%) | 2,965 (65.67%) | 3,315 (67.04%) | 3,680 (70.50%) | 3,385 (68.25%) |
| Diabetes mellitus | 1,160 (29.78%) | 1,245 (27.57%) | 1,525 (30.84%) | 1,670 (31.99%) | 1,620 (32.66%) |
| Cirrhosis | 140 (3.59%) | 125 (2.77%) | 210 (4.25%) | 245 (4.69%) | 210 (4.23%) |
| Race | |||||
| White | 2,515 (68.90%) | 2,990 (69.05%) | 3,245 (67.46%) | 3,555 (69.84%) | 3,370 (69.92%) |
| Black | 240 (6.58%) | 245 (5.66%) | 310 (6.44%) | 325 (6.39%) | 280 (5.81%) |
| Hispanic | 500 (13.70%) | 580 (13.39%) | 715 (14.86%) | 600 (11.79%) | 690 (14.32%) |
| Asian or Pacific Islander | 225 (6.16%) | 300 (6.93%) | 344 (7.17%) | 355 (6.97%) | 325 (6.74%) |
| Native American | 30 (0.82%) | 25 (0.58%) | 45 (0.94%) | 45 (0.88%) | 50 (1.04%) |
| Other | 140 (3.84%) | 190 (4.39%) | 150 (3.12%) | 210 (4.13%) | 105 (2.18%) |
| Age group | |||||
| 18 - 30 | 130 (3.34%) | 165 (3.65%) | 135 (2.73%) | 115 (2.20%) | 135 (2.86%) |
| 31 - 40 | 135 (3.47%) | 195 (4.32%) | 230 (4.65%) | 180 (3.45%) | 160 (3.39%) |
| 41 - 50 | 210 (5.39%) | 245 (5.43%) | 315 (6.37%) | 265 (5.08%) | 265 (5.61%) |
| 51 - 60 | 550 (14.12%) | 560 (12.40%) | 520 (10.52%) | 700 (13.41%) | 510 (10.81%) |
| 61 - 70 | 785 (20.15%) | 925 (20.49%) | 1,085 (21.94%) | 1,080 (20.69%) | 985 (20.87%) |
| 71 - 80 | 925 (23.75%) | 910 (20.16%) | 1,070 (21.64%) | 1,190 (22.80%) | 1,065 (22.56%) |
| > 80 | 1,160 (29.78%) | 1,515 (33.55%) | 1,590 (32.15%) | 1,690 (32.38%) | 1,600 (33.90%) |
| Non-teaching hospitals | Teaching hospitals | P-value | |
|---|---|---|---|
| aAfter matching propensity score 1:1 to adjust baseline differences. National Inpatient Sample database (2016 - 2020). CHF: congestive heart failure. | |||
| Total | 6,765 | 6,505 | |
| Female | 3,330 (51.19%) | 3,180.0 (48.89%) | 0.0085 |
| Race | < 0.001 | ||
| White | 5,065.0 (77.86%) | 4,730.0 (72.71%) | |
| Black | 235.0 (3.61%) | 300.0 (4.61%) | |
| Other | 1,205.0 (18.52%) | 1,475.0 (22.67%) | |
| Comorbidities | |||
| CHF | 970.0 (14.91%) | 875.0 (13.45%) | 0.017 |
| Hypertension | 4,595.0 (70.64%) | 3,860.0 (59.34%) | < 0.0001 |
| Diabetes mellitus | 1,970.0 (30.28%) | 1,880.0 (28.90%) | 0.0839 |
| Alcohol abuse | 170.0 (2.61%) | 250.0 (3.84%) | < 0.0001 |
| Cirrhosis | 195.0 (3.00%) | 330.0 (5.07%) | < 0.0001 |
| Non-teaching hospitals | Teaching hospitals | P-value | |
|---|---|---|---|
| aAfter matching propensity score 1:1 to adjust baseline differences; National Inpatient Sample database (2016 - 2020). CVC: central venous catheter; ERCP: endoscopic retrograde cholangiopancreatography; ICU: intensive care unit; PSC: primary sclerosing cholangitis. | |||
| Total | 6,505 | 6,505 | |
| Primary outcomes | |||
| Inpatient mortality | 135.0 (2.08%) | 180.0 (2.77%) | 0.0103 |
| Length of hospital stay (days) | 5.54 (± 10.87) | 6.38 (± 16.12) | |
| Total hospitalization costs (USD) | 18,547 (± 40,714) | 21,251 (± 52,898) | |
| Secondary outcomes | |||
| Septic shock | 815.0 (12.53%) | 1,045 (16.06%) | < 0.0001 |
| Intubation | 225.0 (3.46%) | 345.0 (5.30%) | < 0.0001 |
| ICU | 330.0 (5.07%) | 430.0 (6.61%) | 0.0002 |
| CVC | 150.0 (2.31%) | 145.0 (2.23%) | 0.7684 |
| ERCP | 160.0 (2.46%) | 170 (2.61%) | 0.5771 |
| Etiology | |||
| Gallstone | 1,105.0 (16.22%) | 940.0 (14.45%) | 0.0051 |
| Biliary stricture | 110.0 (1.69%) | 125.0 (1.92%) | 0.3234 |
| PSC | 0.0 (0.0%) | 5.0 (0.08%) | 0.0253 |
| 2016 | 2017 | 2018 | 2019 | 2020 | P-value | |
|---|---|---|---|---|---|---|
| National Inpatient Sample database (2016 - 2020). CVC: central venous catheter; ICU: intensive care unit; PSC: primary sclerosing cholangitis. | ||||||
| Total, 6,760 | 1,575 | 1,410 | 1,435 | 1,230 | 1,110 | |
| Primary outcomes | ||||||
| Inpatient mortality | 40 (2.54%) | 30 (2.13%) | 45 (3.14%) | 10 (0.81%) | 20 (1.80%) | 0.0008 |
| Length of stay (days) | 6.29 | 5.72 | 5.67 | 4.80 | 4.93 | |
| Total hospitalization costs (USD) | 19,993 | 18,895 | 19,308 | 17,781 | 18,763 | |
| Secondary outcomes | ||||||
| Septic shock | 195 (12.38%) | 155 (10.99%) | 170 (11.81%) | 190 (15.45%) | 120 (10.81%) | 0.0028 |
| Intubation | 80 (5.08%) | 45 (3.19%) | 60 (4.17%) | 20 (1.63%) | 30 (2.70%) | < 0.0001 |
| ICU | 110 (6.98%) | 70 (4.96%) | 100 (6.94%) | 25 (2.03%) | 35 (3.15%) | < 0.0001 |
| Pressors | 15 (0.95%) | 20 (1.42%) | 35 (2.43%) | 35 (2.85%) | 20 (1.80%) | 0.0013 |
| CVC | 50 (3.17%) | 25 (1.77%) | 60 (4.17%) | 5 (0.41%) | 10 (0.90%) | < 0.0001 |
| Etiology | ||||||
| Biliary stricture | 25 (1.59%) | 5 (0.35%) | 35 (2.43%) | 35 (2.85%) | 10 (0.90%) | < 0.0001 |
| Gallstone | 275 (17.46%) | 230 (16.31%) | 210 (14.58%) | 240 (19.51%) | 150 (13.51%) | 0.0004 |
| Choledocholithiasis | 0 (0.0%) | 0 (0.0%) | 0 (0.0%) | 0 (0.0%) | 0 (0.0%) | |
| PSC | 0 (0.0%) | 0 (0.0%) | 0 (0.0%) | 0 (0.0%) | 0 (0.0%) | |
| 2016 | 2017 | 2018 | 2019 | 2020 | P-value | |
|---|---|---|---|---|---|---|
| National Inpatient Sample database (2016 - 2020). CVC: central venous catheter; ICU: intensive care unit; PSC: primary sclerosing cholangitis. | ||||||
| Total, 23,535 | 3,895 | 4,515 | 4,945 | 5,220 | 4,960 | |
| Primary outcomes | ||||||
| Inpatient mortality | 135 (3.48%) | 135 (2.99%) | 115 (2.33%) | 175 (3.35%) | 150 (3.02%) | 0.0117 |
| Length of stay (days) | 6.34 | 6.41 | 6.68 | 6.08 | 6.42 | |
| Total hospitalization costs (USD) | 20,287 | 20,858 | 21,703 | 21,255 | 23,902 | |
| Secondary outcomes | ||||||
| Septic shock | 600 (15.40%) | 670 (14.84%) | 845 (17.09%) | 760 (14.56%) | 805 (16.23%) | 0.0028 |
| Intubation | 195 (5.01%) | 210 (4.65%) | 245 (4.95%) | 170 (3.26%) | 205 (4.13%) | < 0.0001 |
| ICU | 250 (6.42%) | 290 (6.42%) | 345 (6.98%) | 210 (4.02%) | 255 (5.14%) | < 0.0001 |
| Pressors | 75 (1.93%) | 115 (2.55%) | 180 (3.64%) | 195 (3.74%) | 185 (3.73%) | < 0.0001 |
| CVC | 110 (2.82%) | 100 (2.21%) | 145 (2.93%) | 50 (0.96%) | 75 (1.51%) | < 0.0001 |
| Etiology | ||||||
| Biliary stricture | 90 (2.31%) | 90 (1.99%) | 110 (2.22%) | 90 (1.72%) | 165 (3.33%) | < 0.0001 |
| Gallstone | 530 (13.61%) | 675 (14.95%) | 780 (15.77%) | 770 (14.75%) | 640 (12.90%) | 0.0005 |
| Choledocholithiasis | 0 (0.0%) | 0 (0.0%) | 0 (0.0%) | 0 (0.0%) | 0 (0.0%) | |
| PSC | 0 (0.0%) | 0 (0.0%) | 5 (0.10%) | 20 (0.38%) | 0 (0.0%) | < 0.0001 |
| Non-teaching hospitals | Teaching hospitals | P-value | |
|---|---|---|---|
| aAfter matching propensity score 1:1 to adjust baseline differences. National Inpatient Sample database (2016 - 2020). CVC: central venous catheter; ERCP: endoscopic retrograde cholangiopancreatography; ICU: intensive care unit. | |||
| Total | 165 | 430 | |
| Inpatient mortality | 0 | 15 (3.49%) | 0.0260 |
| Septic shock | 10 (6.06%) | 65 (15.12%) | 0.0238 |
| Intubation | 0 | 10 (2.33%) | 0.0693 |
| ICU | 0 | 10 (2.33%) | 0.0693 |
| CVC | 0 | 0 | |
| Non-teaching hospitals | Teaching hospitals | P-value | |
|---|---|---|---|
| aAfter matching propensity score 1:1 to adjust baseline differences. National Inpatient Sample database (2016 - 2020). ERCP: endoscopic retrograde cholangiopancreatography; PEP: post-ERCP pancreatitis. | |||
| Total | 165 | 430 | |
| PEP | 0 | 20 (4.65%) | 0.0136 |
| Cholecystitis | 30 (18.18%) | 105 (24.42%) | 0.0065 |
| Bleeding | 0 | 5 (1.16%) | 0.1904 |
| Perforation | 0 | 0 | |