Gastroenterology Research, ISSN 1918-2805 print, 1918-2813 online, Open Access |
Article copyright, the authors; Journal compilation copyright, Gastroenterol Res and Elmer Press Inc |
Journal website https://gr.elmerpub.com |
Original Article
Volume 18, Number 4, August 2025, pages 182-191
Trends in Hepatitis C and Hepatitis B Deaths Identify Successes and Disparities, Alameda County, CA, 2005 - 2022
Figures
Tables
Characteristics | Total deaths, n (%) | HBV, n (%)a | HCV, n (%)a | P valueb |
---|---|---|---|---|
aICD-10 coding definitions: HBV, B16, B17.0, B18.0, B18.1; HCV, B17.1, B18.2; HIV, B20.x-B24.x; diabetes, E10.x-E14.x; cardiovascular, IXX.x; drug dependence, X40.x-X44.x, Y10.x-Y16.x, X60.x-X64.x, F11.x, F13.x, F15.x; alcohol-associated liver disease, K70.x; hepatocellular carcinoma, C22.x, D37.6; cirrhosis, K71.7, K70.3, K74.1-K74.6; liver failure, K70.4, K72. bP value for tests of significance between HBV and HCV statuses. P value calculated using Kruskal-Wallis test for age and Chi-square test for all other variables. Note: Cells with counts < 10 and that are not unknown are suppressed as well as their complementary cells, indicated with a “-” to avoid inadvertent disclosure of identity. HBV: hepatitis B virus; HCV: hepatitis C virus; HIV: human immunodeficiency virus; HPI: Healthy Places Index; IQR: interquartile range. | ||||
Total | 2,122 | 313 | 1,809 | - |
Sex | ||||
Female | 664 (31.3) | 81 (25.9) | 583 (32.2) | 0.03 |
Male | 1,458 (68.7) | 232 (74.1) | 1,226 (67.8) | |
Race and ethnicity | ||||
African American/Black | 640 (30.2) | 29 (9.3) | 611 (33.8) | < 0.001 |
American Indian/Alaskan Native | 10 (0.5) | 0 (0.0) | 10 (0.6) | |
Asian | 357 (16.8) | 229 (73.2) | 128 (7.1) | |
Hispanic/Latinx | 330 (15.6) | 10 (3.2) | 320 (17.7) | |
Pacific Islander | 16 (0.8) | - | - | |
Multirace | - | - | 43 (2.4) | |
White | 714 (33.6) | 32 (10.2) | 682 (37.7) | |
Unknown | - | - | - | |
Age (median (IQR)) | 62 (56, 69) | 65 (57, 73) | 62 (56, 69) | 0.001 |
Nativity | ||||
Born in the United States | 1,541 (72.6) | 61 (19.5) | 1,480 (81.8) | < 0.001 |
Born outside the United States | 504 (23.8) | 247 (78.9) | 257 (14.2) | |
Unknown | 77 (3.6) | 5 (1.6) | 72 (4.0) | |
HPI quartile | ||||
1 | 330 (15.6) | 23 (7.3) | 307 (17.0) | < 0.001 |
2 | 582 (27.4) | 91 (29.1) | 491 (27.1) | |
3 | 611 (28.8) | 98 (31.3) | 513 (28.4) | |
4 | 543 (25.6) | 98 (31.3) | 445 (24.6) | |
Unknown | 56 (2.6) | 3 (1.0) | 53 (2.9) | |
Selected other causes of deatha | ||||
HIV | - | - | 60 (3.3) | 0.15 |
Diabetes | 299 (14.1) | 43 (13.7) | 256 (14.2) | 0.92 |
Cardiovascular | 982 (46.3) | 127 (40.6) | 855 (47.3) | 0.03 |
Drug dependence | - | - | 36 (2.0) | 0.06 |
Alcohol-associated liver disease | 213 (10.0) | 8 (2.6) | 205 (11.3) | < 0.001 |
Hepatocellular carcinoma | 491 (23.1) | 115 (36.7) | 376 (20.8) | < 0.001 |
Cirrhosis | 902 (42.5) | 109 (34.8) | 793 (43.8) | 0.004 |
Liver failure | 356 (16.8) | 43 (13.7) | 313 (17.3) | 0.14 |
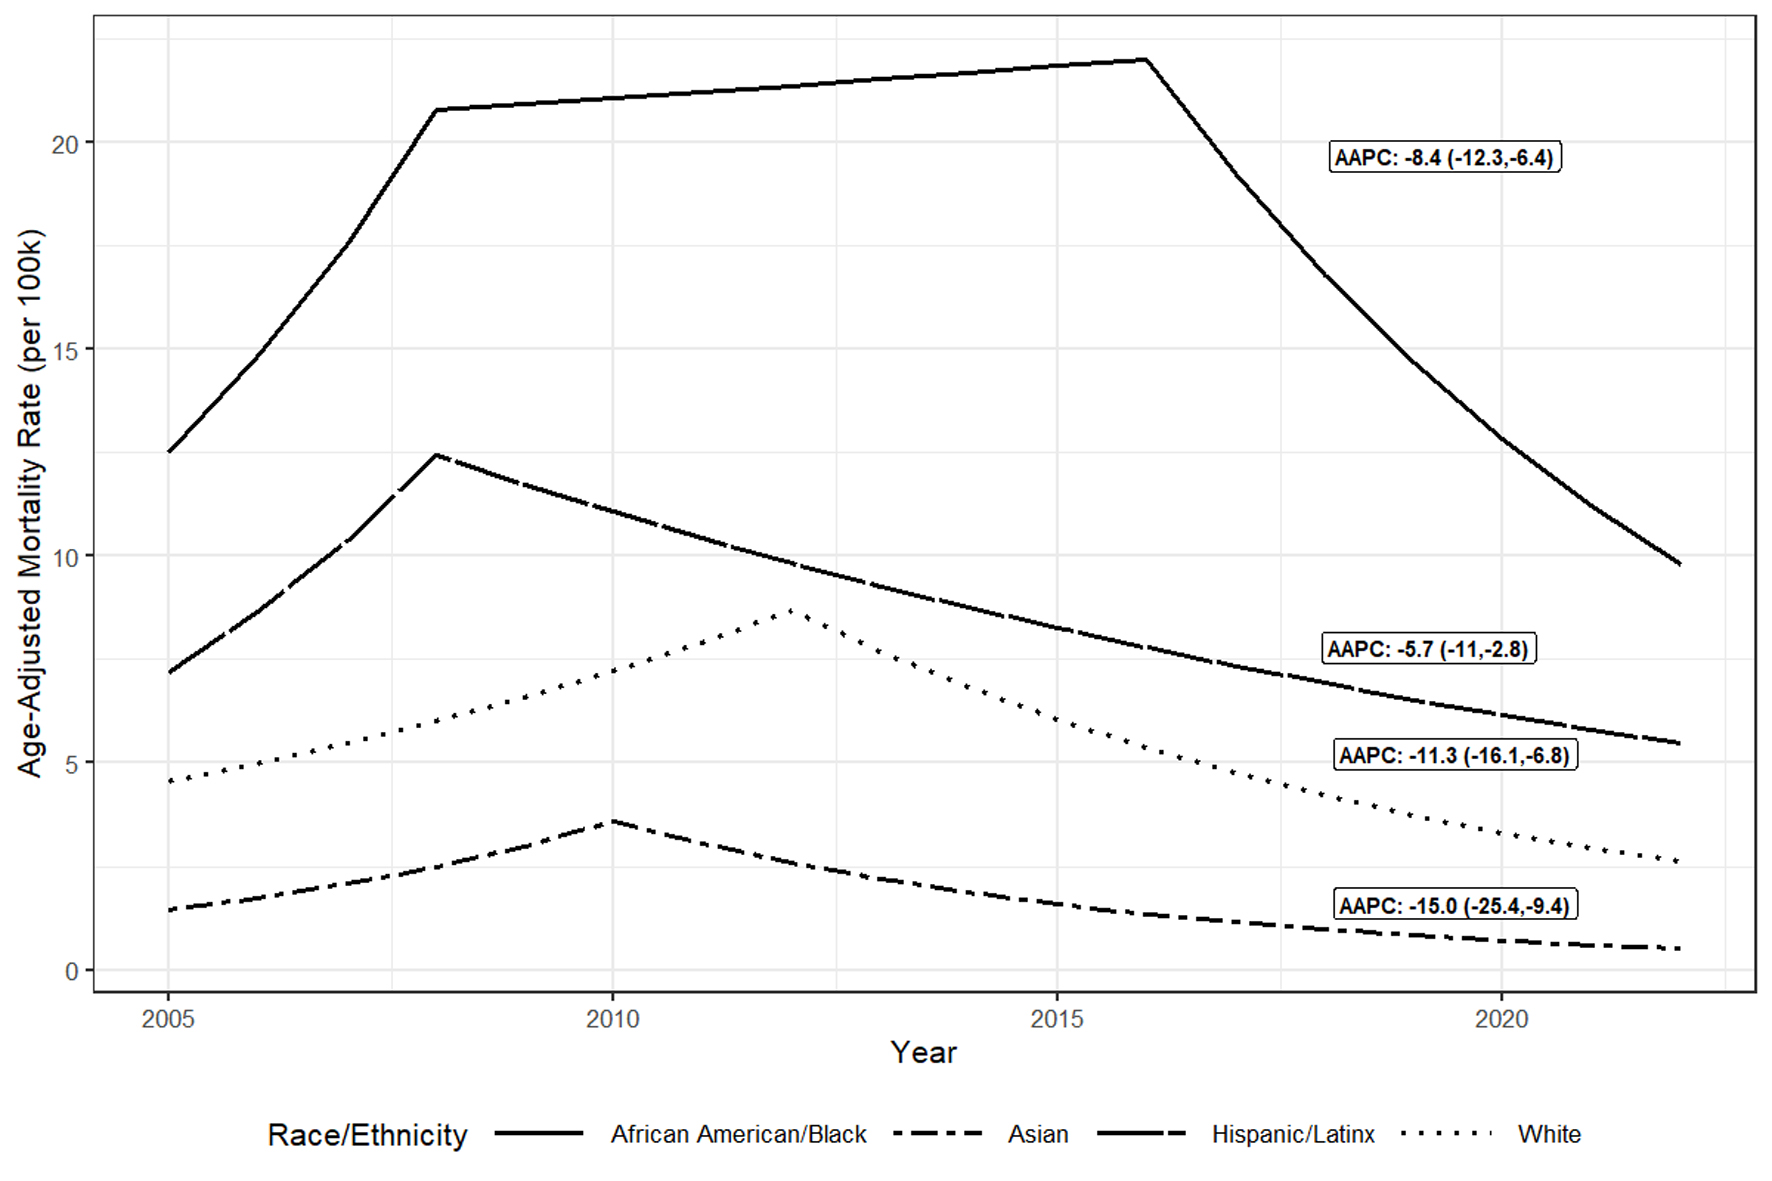
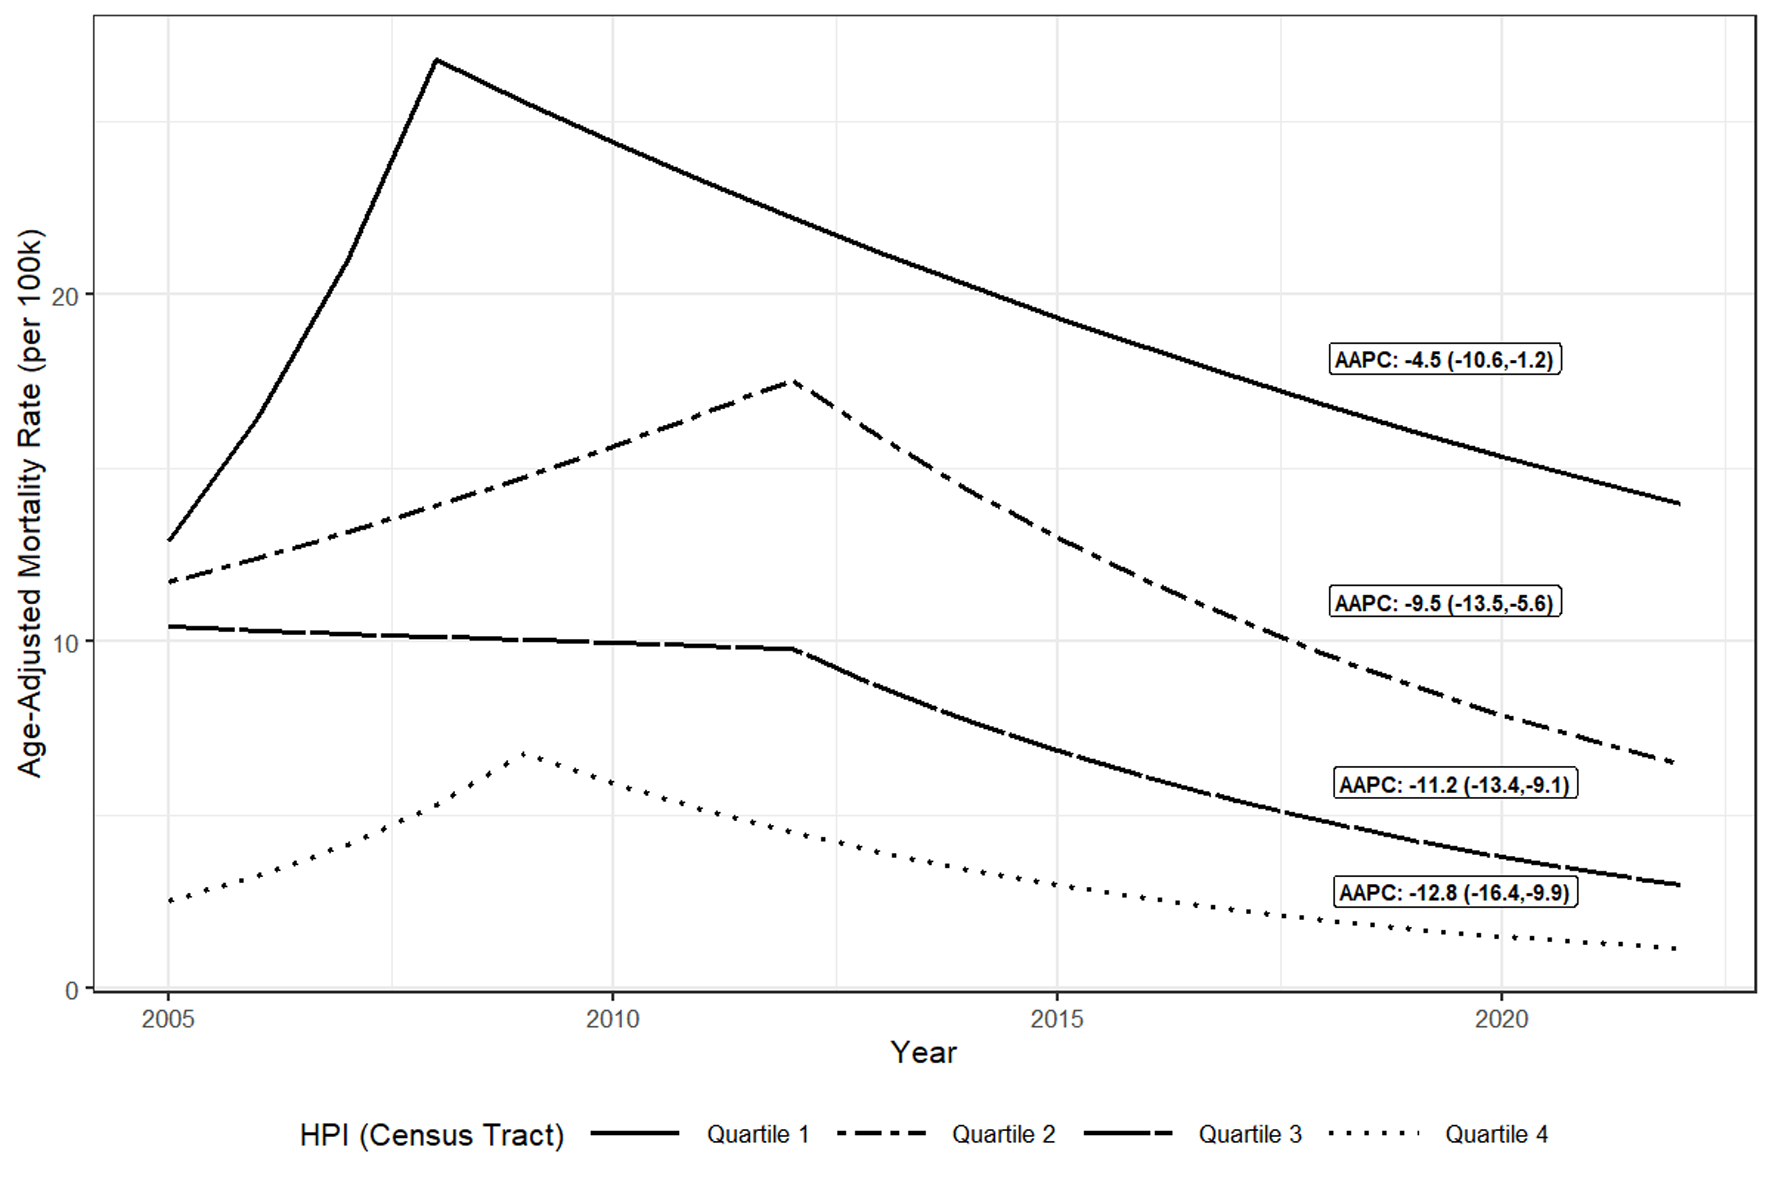
Group | Time period | AAPC (95% CI)b | APC (95% CI)c |
---|---|---|---|
aIncludes decedents with HBV or HCV listed in multiple cause of death on death certificate; excludes decedents with both HBV and HCV listed. b10-year (2013 - 2022) AAPCs were calculated for all groups. APC periods are dependent on best model fit for that particular group. AAPCs and APCs were calculated using Joinpoint regression. cP < 0.05 for all AAPCs. Note: “-“ indicates N/A. AAPC: average annual percent change; APC: annual percent change; 95% CI: 95% confidence interval; HCV: hepatitis C virus; HPI: Healthy Places Index. | |||
Race/ethnicity | |||
Asian | 2013 - 2022 | -15.0 (-25.4, -9.4) | - |
2005 - 2010 | - | 19.8 (-4.9, 149.3) | |
2010 - 2022 | - | -15.0 (-48.6, -9.5) | |
African American/Black | 2013 - 2022 | -8.4 (-12.3, -6.4) | - |
2005 - 2008 | - | 18.4 (3.4, 52.2) | |
2008 - 2016 | - | 0.7 (-22.9, 5) | |
2016 - 2022 | - | -12.6 (-29.5, 2) | |
Hispanic/Latinx | 2013 - 2022 | -5.7 (-11, -2.8) | - |
2005 - 2008 | - | 20.0 (-3.3, 70.9) | |
2008 - 2022 | - | -5.7 (-21.3, -2.7) | |
White | 2013 - 2022 | -11.3 (-16.1, -6.8) | - |
2005 - 2012 | - | 9.7 (1.1, 31.6) | |
2012 - 2022 | - | -11.3 (-19.5, -6.8) | |
HPI | |||
Quartile 1 | 2013 - 2022 | -4.5 (-10.6, -1.2) | - |
2005 - 2008 | - | 27.5 (-0.9, 107.2) | |
2008 - 2022 | - | -4.5 (-31.1, -1.2) | |
Quartile 2 | 2013 - 2022 | -9.5 (-13.5, -5.6) | - |
2005 - 2012 | - | 5.9 (-1.2, 29.2) | |
2012 - 2022 | - | -9.5 (-19.2, -5.7) | |
Quartile 3 | 2013 - 2022 | -11.2 (-13.4, -9.1) | - |
2005 - 2012 | - | -0.9 (-4.6, 6.6) | |
2012 - 2022 | - | -11.2 (-14.6, -9.1) | |
Quartile 4 | 2013 - 2022 | -12.8 (-16.4, -9.9) | - |
2005 - 2009 | - | 28.0 (8, 73.1) | |
2009 - 2022 | - | -12.8 (-16.6, -9.9) |