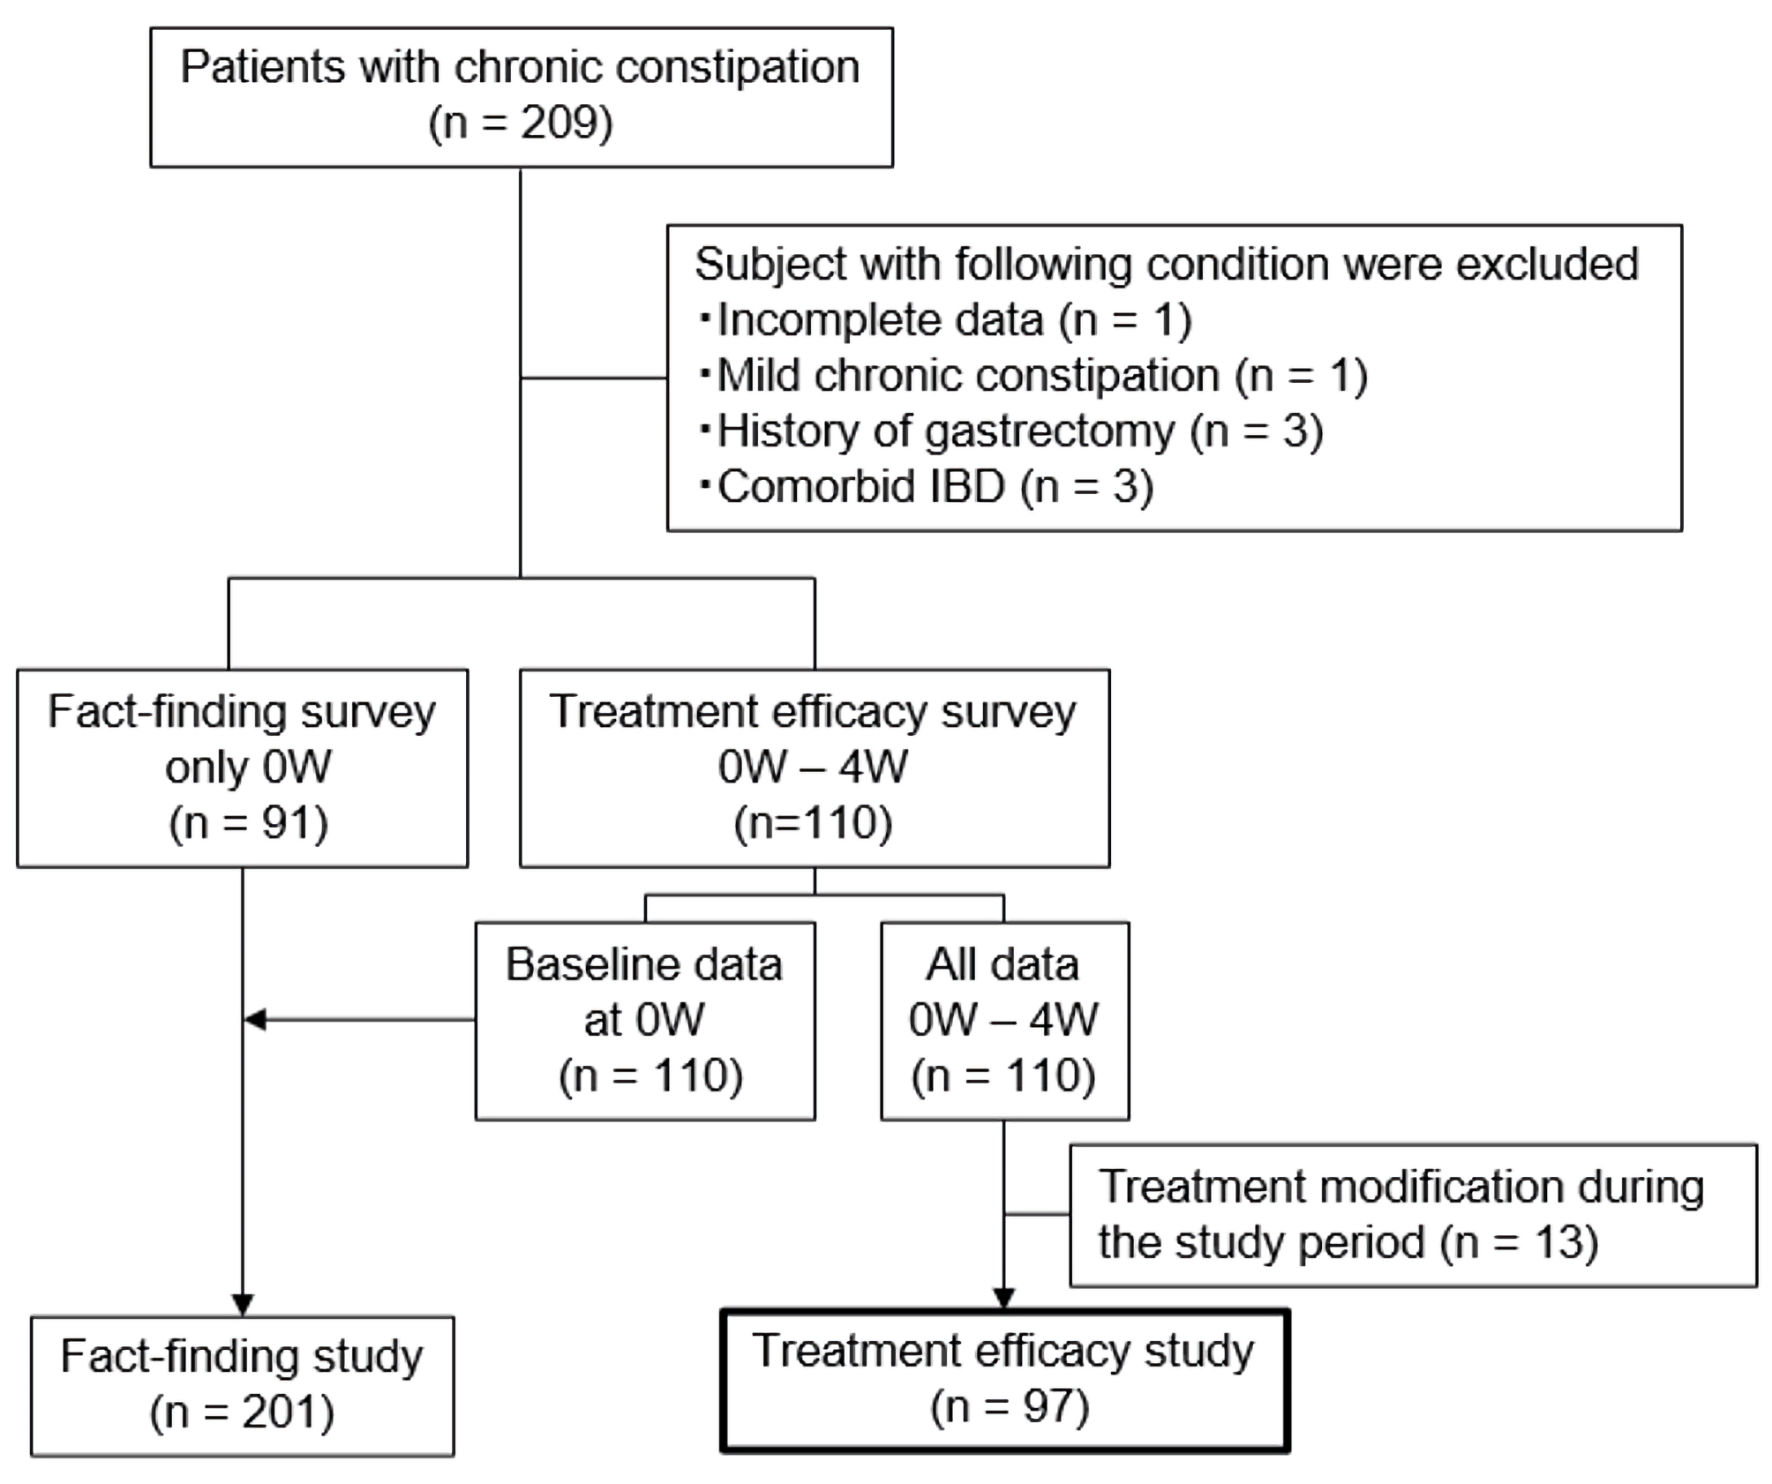
↓ Figure 1. Flowchart of study participants. W: week; IBD: inflammatory bowel disease.
| Gastroenterology Research, ISSN 1918-2805 print, 1918-2813 online, Open Access |
| Article copyright, the authors; Journal compilation copyright, Gastroenterol Res and Elmer Press Inc |
| Journal website https://gr.elmerpub.com |
Original Article
Volume 19, Number 1, February 2026, pages 43-53
Early Therapeutic Response Predicts Outcome in Chronic Constipation: A Multicenter Prospective Observational Study
Figures
Tables
| Domain | Subdomain | Item number | Items | Response form | Subscale | Definitions of SS |
|---|---|---|---|---|---|---|
| CC-TEST: Chronic Constipation-Therapeutic Efficacy and Satisfaction Test; LS: Likert scale; Sx: symptom; SS: subscale. | ||||||
| Symptoms | Symptoms | Item 1 - 7 | ||||
| Item 1 | Infrequent bowel movements | 7-point LS | Stool Sx-SS | Mean of items 1and 2 | ||
| Item 2 | Hard stool | Defecation Sx-SS | Mean of items 3, 4 and 7 | |||
| Item 3 | Difficulty in defecation | Abdominal Sx-SS | Mean of items 5 and 6 | |||
| Item 4 | Feeling of incomplete bowel movements | Total symptom score | Mean of stool Sx-SS, defecation Sx-SS and abdominal Sx-SS | |||
| Item 5 | Abdominal pain | |||||
| Item 6 | Abdominal discomfort | |||||
| Item 7 | Anal pain during defecation | |||||
| Defecation status | Item 8 - 12 | |||||
| Item 8 | Number of bowel movements during the past week | Number | ||||
| Item 9 | Number of forced bowel movements during the past week | |||||
| Number of spontaneous bowel movements during the past week (item 8 - item 9) | ||||||
| Item 10 | Bristol Stool Form Scale | 7-point LS | ||||
| Item 11 | Time to defecate | 6-point LS | ||||
| Item 12 | Defecation assistance | 5-point LS | ||||
| Impact for daily life | Item 13 - 16 | |||||
| Item 13 | Dissatisfaction with daily activity | 5-point LS | Dissatisfaction for daily life-SS | Mean of items 13, 14, 15 and 16 | ||
| Item 14 | Dissatisfaction with the mood | |||||
| Item 15 | Dissatisfaction with eating | |||||
| Item 16 | Dissatisfaction with overall constipation symptoms | |||||
| Therapeutic response | Item 17 - 20 | |||||
| Item 17 | Desire for additional medication | 5-point LS | ||||
| Item 18 | Patient’s impression of the therapy | |||||
| Item 19 | Numeric rating scale | 0 - 10 scale | ||||
| Item 20 | Compliance with the medication | 5-point LS | ||||
| BMI: body mass index; OTCM: over-the-counter medication; SD: standard deviation. | |
| Age (mean ± SD) | 66.4 ± 15.4 |
| Sex | |
| Female | 69 (71%) |
| Male | 28 (29%) |
| BMI (mean ± SD) | 21.7 ± 3.2 |
| Duration of constipation, month (mean ± SD) (month) | 165.6 ± 169.7 |
| History of hospital visit due to constipation, yes | 69 (71%) |
| Severity of constipation | |
| Severe | 8 (8%) |
| Moderate | 89 (92%) |
| OTCM, yes | 22 (23%) |
| Pre-study medication, yes | 70 (72%) |
| Magnesium oxide | 33 |
| New constipation treatment medication | 26 |
| Stimulant laxatives | 18 |
| Kampo medicine | 13 |
| Others | 21 |
| Number of pre-study medication | |
| 1 | 36 |
| 2 | 23 |
| 3 | 6 |
| 4 | 2 |
| 5 | 2 |
| Abdominal surgery, yes | 40 (41%) |
| Open | 28 |
| Laparoscopic surgery | 8 |
| Unclear | 4 |
| Childbirth, yes | 42 (61%) |
| Vaginal delivery | 35 |
| Cesarean section | 6 |
| Unclear | 1 |
| Coexisting disorders, yes | 71 (73%) |
| Endocrine and metabolic disorders | 35 |
| Neurological disorders | 8 |
| Collagen disease | 5 |
| Degenerative disorders | 1 |
| Mental disorders | 13 |
| Colorectal and anal disorders | 33 |
| Others | 11 |
| Number of coexisting conditions | |
| 1 | 44 |
| 2 | 20 |
| 3 | 6 |
| 4 | 1 |
| Medications causing constipation, yes | 57 (60%) |
| Number of medications causing constipation | |
| 1 | 29 |
| 2 | 22 |
| 3 | 6 |
| Types of study prescription medications | |
| New constipation treatment medication | 87 |
| Stimulant laxatives | 20 |
| Magnesium oxide | 23 |
| Kampo medicine | 7 |
| Others | 25 |
| Number of study medication | |
| 1 | 55 |
| 2 | 22 |
| 3 | 14 |
| 4 | 3 |
| 5 | 3 |
| Items/subscales | Baseline (n = 109) | 2 W (n = 109) | 0 W vs. 2 W | 4 W (n = 107) | 0 W vs. 4 W | |||||||
|---|---|---|---|---|---|---|---|---|---|---|---|---|
| Mean | SD | Mean | SD | Δscore (2 W - 0 W) | P value | Cohen’s d | Mean | SD | Δscore (4 W - 0 W) | P value | Cohen’s d | |
| Interpretation of effect size (Cohen’s d): small ≥ 0.20, medium ≥ 0.50, large ≥ 0.80. W: week; SD: standard deviation; Sx: symptom; SS: subscale; BSFS: Bristol Stool Form Scale; SBM: spontaneous bowel movement. | ||||||||||||
| Infrequent bowel movements | 4.1 | 1.3 | 3.1 | 1.4 | -1.0 | < 0.001 | 0.73 | 2.8 | 1.4 | -1.3 | < 0.001 | 0.94 |
| Hard stool | 4.4 | 1.5 | 3.0 | 1.6 | -1.4 | < 0.001 | 0.89 | 2.7 | 1.7 | -1.7 | < 0.001 | 1.07 |
| Difficulty in defecation | 4.5 | 1.5 | 3.1 | 1.6 | -1.5 | < 0.001 | 0.95 | 2.9 | 1.7 | -1.6 | < 0.001 | 1.00 |
| Feeling of incomplete bowel movements | 3.8 | 1.4 | 3.2 | 1.5 | -0.6 | < 0.001 | 0.43 | 3.1 | 1.5 | -0.7 | < 0.001 | 0.47 |
| Abdominal pain | 2.9 | 1.7 | 2.3 | 1.2 | -0.6 | 0.001 | 0.39 | 2.3 | 1.3 | -0.6 | < 0.001 | 0.38 |
| Abdominal discomfort | 4.1 | 1.5 | 3.2 | 1.5 | -0.8 | < 0.001 | 0.54 | 3.1 | 1.5 | -0.9 | < 0.001 | 0.63 |
| Anal pain during defecation | 2.9 | 1.7 | 2.3 | 1.4 | -0.6 | 0.002 | 0.42 | 2.2 | 1.3 | -0.8 | < 0.001 | 0.51 |
| Stool Sx-SS | 4.3 | 1.3 | 3.1 | 1.4 | -1.2 | < 0.001 | 0.89 | 2.8 | 1.4 | -1.5 | < 0.001 | 1.12 |
| Defecation Sx-SS | 3.8 | 1.2 | 2.8 | 1.2 | -0.9 | < 0.001 | 0.75 | 2.7 | 1.3 | -1.0 | < 0.001 | 0.81 |
| Abdominal Sx-SS | 3.5 | 1.4 | 2.8 | 1.2 | -0.7 | < 0.001 | 0.54 | 2.7 | 1.2 | -0.8 | < 0.001 | 0.57 |
| Total symptom score | 3.8 | 1.1 | 2.9 | 1.1 | -0.9 | < 0.001 | 0.84 | 2.7 | 1.2 | -1.1 | < 0.001 | 0.95 |
| Number of bowel movements during the past week | 4.4 | 4.7 | 6.9 | 10.5 | 2.5 | 0.020 | 0.30 | 6.1 | 5.1 | 1.7 | 0.001 | 0.34 |
| Number of forced bowel movements during the past week | 2.2 | 3.8 | 3.0 | 5.2 | 0.8 | 0.102 | 0.17 | 2.9 | 4.6 | 0.7 | 0.133 | 0.16 |
| Number of spontaneous bowel movements during the past week | 2.2 | 3.9 | 3.9 | 7.2 | 1.5 | 0.016 | 0.29 | 3.2 | 4.0 | 1.0 | 0.012 | 0.25 |
| |SBM-7| | 5.6 | 2.6 | 5.6 | 5.4 | 0.1 | 0.916 | 0.01 | 4.7 | 2.9 | -0.9 | 0.012 | 0.31 |
| Bristol Stool Form Scale | 2.7 | 1.8 | 4.0 | 1.7 | 1.3 | < 0.001 | 0.73 | 4.1 | 1.7 | 1.3 | < 0.001 | 0.75 |
| |BSFS-4| | 1.9 | 1.1 | 1.4 | 1.0 | -0.5 | < 0.001 | 0.48 | 1.3 | 1.1 | -0.6 | < 0.001 | 0.52 |
| Time to defecate | 2.6 | 1.3 | 2.0 | 1.1 | -0.6 | < 0.001 | 0.45 | 1.9 | 1.1 | -0.7 | < 0.001 | 0.56 |
| Defecation assistance | 2.3 | 1.2 | 1.7 | 1.1 | -0.6 | < 0.001 | 0.48 | 1.6 | 1.0 | -0.7 | < 0.001 | 0.60 |
| Dissatisfaction with daily activity | 2.6 | 1.1 | 2.4 | 1.2 | -0.2 | 0.034 | 0.19 | 2.2 | 1.1 | -0.4 | < 0.001 | 0.33 |
| Dissatisfaction with the mood | 2.8 | 1.2 | 2.4 | 1.2 | -0.3 | 0.004 | 0.27 | 2.3 | 1.1 | -0.5 | 0.004 | 0.40 |
| Dissatisfaction with eating | 2.3 | 1.3 | 1.9 | 1.2 | -0.4 | 0.001 | 0.35 | 1.9 | 1.1 | -0.4 | < 0.001 | 0.34 |
| Dissatisfaction with overall constipation symptoms | 3.6 | 1.1 | 2.9 | 1.1 | -0.7 | < 0.001 | 0.61 | 2.7 | 1.3 | -0.8 | < 0.001 | 0.71 |
| Dissatisfaction with daily life-SS | 2.8 | 0.9 | 2.4 | 1.0 | -0.4 | < 0.001 | 0.46 | 2.3 | 0.9 | -0.5 | < 0.001 | 0.58 |
| Factor | Patient’s impression | NRS | SBM frequency | |||
|---|---|---|---|---|---|---|
| β | P value | β | P value | β | P value | |
| BSFS: Bristol Stool Form Scale; BMI: body mass index; NRS: numerical rating scale; SBM: spontaneous bowel movement; Sx: symptom; SS: subscale. | ||||||
| Age | -0.292 | 0.022 | 0.037 | 0.778 | 0.069 | 0.577 |
| Sex (female) | -0.117 | 0.368 | -0.001 | 0.997 | 0.047 | 0.713 |
| BMI | -0.040 | 0.717 | 0.106 | 0.364 | 0.003 | 0.980 |
| Duration of constipation | -0.009 | 0.938 | -0.023 | 0.848 | 0.168 | 0.145 |
| Stool Sx-SS | -0.263 | 0.125 | -0.214 | 0.217 | -0.149 | 0.371 |
| Defecation Sx-SS | 0.028 | 0.875 | 0.008 | 0.963 | -0.022 | 0.900 |
| Abdominal Sx-SS | -0.011 | 0.937 | 0.089 | 0.557 | -0.027 | 0.854 |
| |SBM-7| | 0.158 | 0.170 | 0.268 | 0.029 | 0.116 | 0.313 |
| |BSFS-4| | -0.085 | 0.472 | -0.002 | 0.987 | 0.133 | 0.251 |
| R2 | 0.146 | 0.186 | 0.118 | 0.385 | 0.086 | 0.580 |
| Interpretation (effect size) | β | R2 | ||||
| Small | ≥ 0.1 | ≥ 0.02 | ||||
| Medium | ≥ 0.3 | ≥ 0.13 | ||||
| Large | ≥ 0.5 | ≥ 0.26 | ||||
| Factor | Patient’s impression | NRS | SBM frequency | |||
|---|---|---|---|---|---|---|
| β | P value | β | P value | β | P value | |
| BSFS: Bristol Stool Form Scale; BMI: body mass index; NRS: numerical rating scale; SBM: spontaneous bowel movement; Sx: symptom; SS: subscale. | ||||||
| Age | -0.271 | 0.016 | -0.018 | 0.882 | 0.083 | 0.460 |
| Sex (female) | -0.138 | 0.228 | 0.020 | 0.876 | 0.001 | 0.996 |
| BMI | -0.136 | 0.174 | 0.043 | 0.695 | 0.062 | 0.537 |
| Duration of constipation | 0.073 | 0.464 | 0.040 | 0.715 | 0.142 | 0.173 |
| Stool Sx-SS | -0.344 | 0.024 | -0.315 | 0.053 | -0.072 | 0.638 |
| Defecation Sx-SS | 0.064 | 0.680 | 0.007 | 0.965 | -0.093 | 0.572 |
| Abdominal Sx-SS | 0.030 | 0.815 | 0.085 | 0.549 | 0.026 | 0.844 |
| |SBM-7| | -0.039 | 0.716 | 0.217 | 0.06 | 0.165 | 0.115 |
| |BSFS-4| | -0.015 | 0.885 | -0.010 | 0.927 | 0.098 | 0.349 |
| Non-responder at week 2 | 0.558 | < 0.001 | 0.429 | < 0.001 | -0.451 | < 0.001 |
| R2 | 0.392 | < 0.0001 | 0.279 | 0.009 | 0.274 | 0.003 |
| Interpretation (effect size) | β | R2 | ||||
| Small | ≥ 0.1 | ≥ 0.02 | ||||
| Medium | ≥ 0.3 | ≥ 0.13 | ||||
| Large | ≥ 0.5 | ≥ 0.26 | ||||