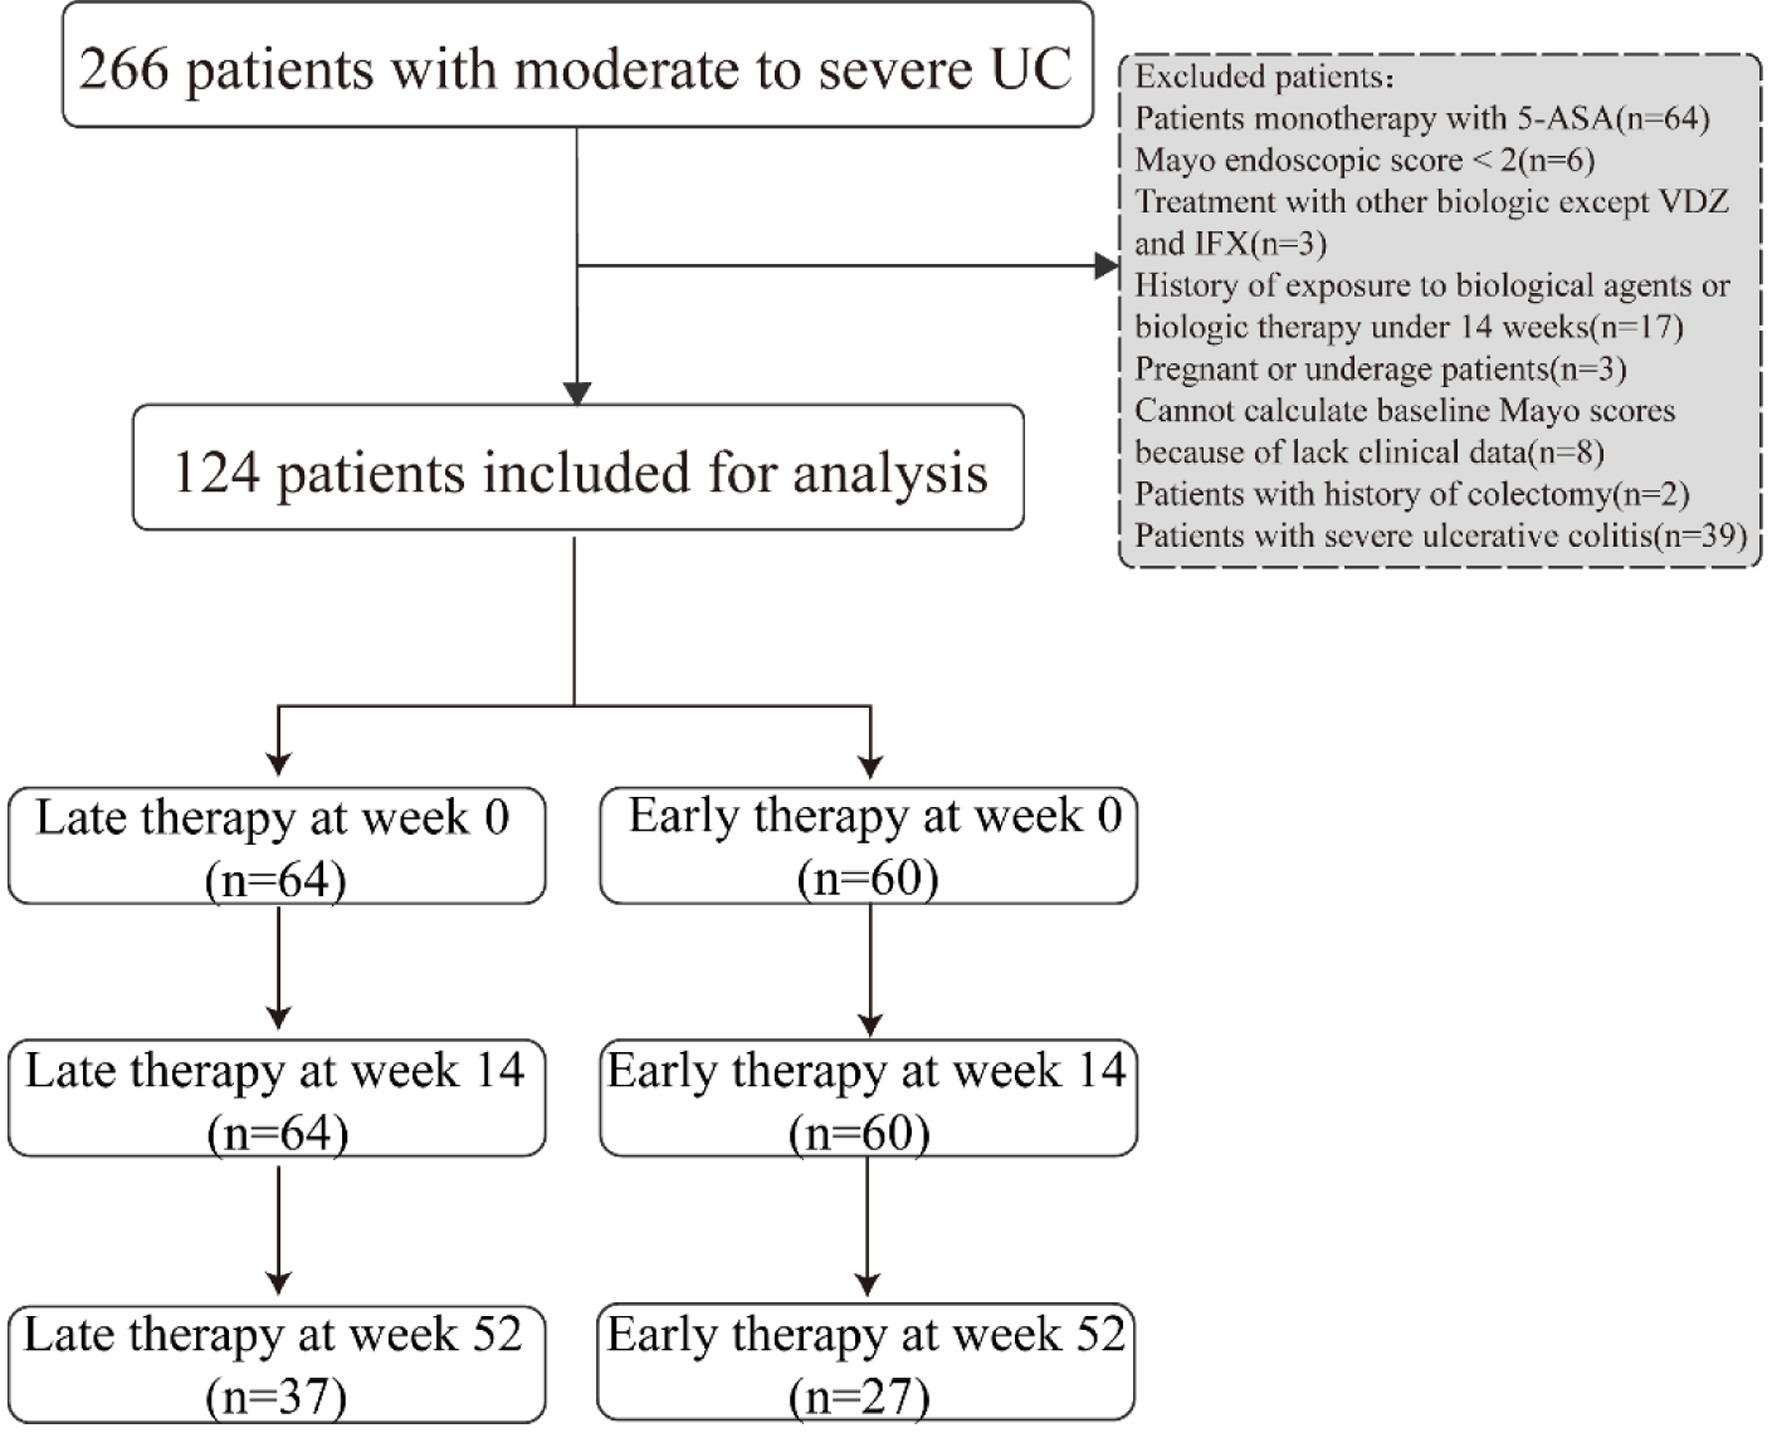
↓ Figure 1. Study flowchart of patients included in analysis.
| Gastroenterology Research, ISSN 1918-2805 print, 1918-2813 online, Open Access |
| Article copyright, the authors; Journal compilation copyright, Gastroenterol Res and Elmer Press Inc |
| Journal website https://gr.elmerpub.com |
Original Article
Volume 19, Number 1, February 2026, pages 35-42
Clinical Efficacy of Early and Late Vedolizumab or Infliximab Interventions in Moderate Ulcerative Colitis: A Multicenter, Retrospective Cohort Study
Figures
Tables
| Baseline matching variables | Late (n = 64) | Early (n = 60) | P value |
|---|---|---|---|
| ALB: albumin; BMI: body mass index; ESR: erythrocyte sedimentation rate; Hb: hemoglobin; hs-CRP: hypersensitive C-reactive protein; IFX: infliximab; IQR: interquartile range; PLT: blood platelet; SD: standard deviation; VDZ: vedolizumab. | |||
| Gender, male, n(%) | 40 (62.5%) | 39 (65.0%) | 0.772 |
| Age, years, median (IQR) | 47.0 (30.3 - 58.0) | 40.5 (32.0 - 56.8) | 0.687 |
| BMI, kg/m2, mean ± SD | 20.5 ± 3.2 | 21.1 ± 3.2 | 0.310 |
| History of smoking, n (%) | 16 (25.0%) | 13 (21.7%) | 0.661 |
| Extraintestinal manifestation, n (%) | 1 (1.6%) | 4 (6.7%) | 0.324 |
| Disease extent, n (%) | 0.310 | ||
| E2 | 27 (42.2%) | 20 (33.3%) | |
| E3 | 37 (57.8%) | 40 (66.7%) | |
| Mayo score, median (IQR) | 8.0 (6.3 - 9.0) | 8.0 (7.0 - 9.0) | 0.224 |
| ESR, mm/h, median (IQR) | 20.5 (6.1 - 37.9) | 26.5 (11.5 - 38.8) | 0.261 |
| hs-CRP, mg/L, median (IQR) | 4.6 (0.7 - 11.4) | 5.5 (1.9 - 37.7) | 0.089 |
| PLT, × 109/L, median (IQR) | 261.0 (209.3 - 338.3) | 301.5 (214.3 - 406.0) | 0.224 |
| Hb, g/L, median (IQR) | 125.0 (110.5 - 139.5) | 127.0 (107.0 - 138.0) | 0.818 |
| ALB, g/L, median (IQR) | 40.3 (36.3 - 44.8) | 38.5 (32.2 - 43.5) | 0.103 |
| Biologics in treatment, n (%) | 0.953 | ||
| VDZ | 27 (42.2%) | 25 (41.7%) | |
| IFX | 37 (57.8%) | 35 (58.3%) | |
| Concomitant medications, n (%) | |||
| Steroid | 7 (10.9%) | 5 (8.3%) | 0.624 |
| Immunosuppressant | 12 (18.8%) | 6 (10.0%) | 0.167 |
| Late | Early | P value | |
|---|---|---|---|
| ALB: albumin; ESR: erythrocyte sedimentation rate; Hb: hemoglobin; hs-CRP: hypersensitive C-reactive protein; IQR: interquartile range; PLT: blood platelet. | |||
| Mayo score, median (IQR) | 3.0 (2.0 - 6.0) | 2.0 (1.0 - 5.8) | 0.266 |
| ESR, mm/h, median (IQR) | 9.0 (5.0 - 27.0) | 7.0 (5.0 - 15.0) | 0.276 |
| hs-CRP, mg/L, median (IQR) | 1.3 (0.5 - 6.3) | 0.9 (0.5 - 3.0) | 0.110 |
| PLT, × 109/L, median (IQR) | 217.0 (178.5 - 313.0) | 223.5 (183.0 - 283.0) | 0.993 |
| Hb, g/L, median (IQR) | 132.0 (115.5 - 145.5) | 130.5 (116.0 - 149.0) | 0.910 |
| ALB, g/L, median (IQR) | 43.1 (39.6 - 46.6) | 44.2 (40.9 - 47.4) | 0.360 |
| Late | Early | |
|---|---|---|
| Treatment discontinuance | ||
| Symptom improvement | 1 | 3 |
| Allergic reaction | 1 | 2 |
| Infection | 1 | 1 |
| Secondary nonresponse | 1 | - |
| Change medication | ||
| Treatment failure | 3 | 7 |
| Abnormal liver function | - | 1 |
| Loss to follow-up | 16 | 12 |
| Colectomy | 1 | 1 |
| At the end of follow-up but less than 52 weeks | 3 | 6 |
| Late | Early | P value | |
|---|---|---|---|
| ALB: albumin; ESR: erythrocyte sedimentation rate; hs-CRP: hypersensitive C-reactive protein; Hb: hemoglobin; IQR: interquartile range; PLT: blood platelet; SD: standard deviation. | |||
| Mayo score, median (IQR) | 2.0 (1.0 - 5.0) | 2.0 (1.0 - 4.0) | 0.737 |
| ESR, mm/h, median (IQR) | 13.0 (8.0 - 22.0) | 6.0 (4.0 - 11.0) | 0.021 |
| hs-CRP, mg/L, median (IQR) | 1.1 (0.5 - 5.6) | 1.0 (0.5 - 4.6) | 0.738 |
| PLT, × 109/L, median (IQR) | 215.5 (174.8 - 319.0) | 245.5 (191.8 - 283.5) | 0.802 |
| Hb, g/L, median (IQR) | 138.5 (119.3 - 149.8) | 147.0 (134.5 - 155.5) | 0.118 |
| ALB, g/L, mean ± SD | 43.3 ± 4.7 | 43.9 ± 3.2 | 0.672 |