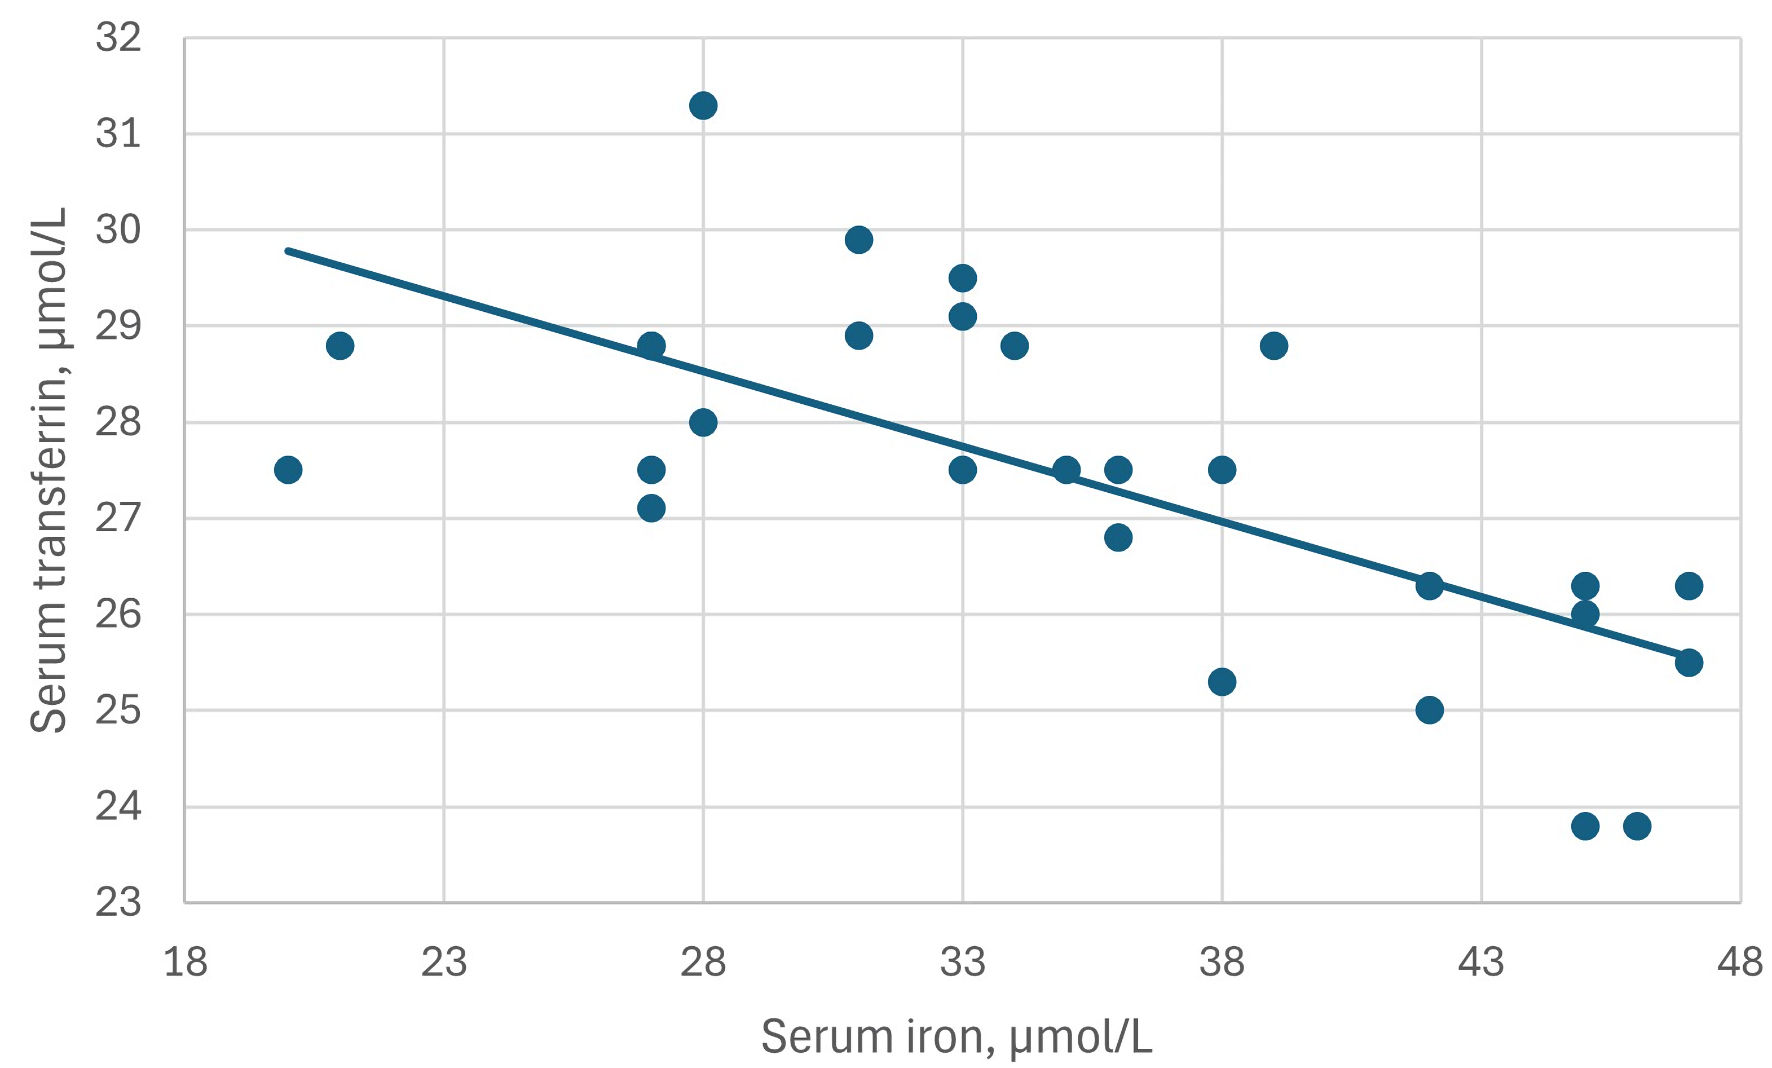
↓ Figure 1. The inverse correlation between serum iron and serum transferrin levels in patient M10. Correlation coefficient rs = -0.68, P = 0.0001.
| Gastroenterology Research, ISSN 1918-2805 print, 1918-2813 online, Open Access |
| Article copyright, the authors; Journal compilation copyright, Gastroenterol Res and Elmer Press Inc |
| Journal website https://gr.elmerpub.com |
Original Article
Volume 18, Number 6, December 2025, pages 276-285
HFE-C282Y/C282Y Hemochromatosis Patients Have Lower Serum Transferrin and Strong Negative Correlations Between Iron, Ferritin, and Transferrin Saturation Versus Transferrin Compared With HFE-wt/wt Wild-Type Subjects
Figures
Tables
| Iron vs. ferritin | Iron vs. transferrin | Ferritin vs. transferrin | Iron vs. TSAT | Ferritin vs. TSAT | Transferrin vs. TSAT | Transferrin, µmol/L | |
|---|---|---|---|---|---|---|---|
| Participants were 45 - 75-year-old men and women, non-blood donors, enrolled in the MONICA study. Spearman’s rank correlation coefficient (rs) was used. Serum transferrin values are presented as arithmetic mean ± standard deviation. aComparison of correlations: P = 0.1; Student’s t-test unpaired values, two-tailed: bP = 0.0004; cP = 0.03; dP < 0.0001. TSAT: transferrin saturation. | |||||||
| All men (n = 441) | rs = 0.21, P < 0.0001 | rs = 0.07, P = 0.8 | rs = -0.08, P = 0.9 | rs = 0.89, P < 0.0001 | rs = 0.23, P < 0.0001 | rs = -0.35, P < 0.0001 | 32.0 ± 4.8 |
| Ferritin 30 - 300 µg/L (n = 405) | rs = 0.15, P = 0.004 | rs = 0.07, P = 0.8 | rs = -0.09, P = 0.9 | rs = 0.90, P < 0.0001 | rs = 0.23, P < 0.0001 | rs = -0.37, P < 0.0001 | 31.8 ± 4.7b, c |
| Ferritin > 300 µg/L (n = 32) | rs = 0.18, P = 0.7 | rs = 0.12, P = 0.8 | rs = 0.07, P = 0.9 | rs = 0.80, P < 0.0001 | rs = 0.15, P = 0.8 | rs = -0.08, P = 0.7 | 29.9 ± 5.2c |
| All women (n = 517) | rs = 0.07, P = 0.9 | rs = -0.05, P = 0.8 | rs = -0.17a, P = 0.0001 | rs = 0.91, P < 0.0001 | rs = 0.14, P = 0.002 | rs = -0.43, P < 0.0001 | 31.3 ± 5.0 |
| Ferritin 30 - 300 µg/L (n = 377) | rs = 0.05, P = 0.9 | rs = 0.02, P = 0.8 | rs = -0.05, P = 0.9 | rs = 0.90, P < 0.0001 | rs = -0.01, P = 0.9 | rs = -0.39, P < 0.0001 | 30.7 ± 4.6b, d |
| Ferritin < 30 µg/L (n = 134) | rs = 0.21, P = 0.07 | rs = -0.23, P = 0.047 | rs = -0.32a, P = 0.005 | rs = 0.95, P < 0.0001 | rs = 0.26, P = 0.02 | rs = -0.49, P < 0.0001 | 33.0 ± 5.4d |
| Men C282Y/C282Y | Iron vs. ferritin | Iron vs. transferrin | Ferritin vs. transferrin | Iron vs. TSAT | Ferritin vs. TSAT | Transferrin vs. TSAT | Transferrin, µmol/L |
|---|---|---|---|---|---|---|---|
| Spearman’s rank correlation coefficient (rs) between serum iron status markers was used. Serum transferrin values are presented as arithmetic mean ± standard deviation. aComparison with corresponding rs for the all-men control group (Table 1) (I = induction treatment; M = maintenance treatment; nr = not relevant). bComparison with corresponding transferrin values for the all-men control group (Table 1). cM8 differ by showing positive correlations between iron and ferritin vs. transferrin. TSAT: transferrin saturation; yrs: years; n: number of consecutive blood samples; I: induction treatment; M: maintenance treatment. | |||||||
| M1, 73 yrs, M (n = 39) | rs = 0.54 | rs = -0.60 | rs = -0.47 | rs = 0.98 | rs = 0.51 | rs = -0.69 | 27.6 ± 1.8 |
| P = 0.0004 | P = 0.0001 | P < 0.0001 | P < 0.0001 | P = 0.001 | P < 0.0001 | P < 0.0001b | |
| P = 0.01a | P = 0.001a | P = 0.003a | P = 1.0a | P = 0.03a | P = 0.003a | ||
| M2, 44 yrs, I (n = 26) | rs = 0.03 | rs = -0.50 | rs = 0.01 | rs = 0.93 | rs = 0.02 | rs = -0.75 | 24.9 ± 2.9 |
| P = 0.9 | P = 0.001 | P = 0.6 | P < 0.0001 | P = 0.9 | P < 0.0001 | P < 0.0001b | |
| nra | P = 0.013a | nra | P = 1.0a | nra | P = 0.002a | ||
| M3, 69 yrs, I (n = 14) | rs = 0.92 | rs = -0.64 | rs = -0.71 | rs = 0.92 | rs = 0.91 | rs = -0.82 | 23.2 ± 1.9 |
| P < 0.0001 | P = 0.02 | P = 0.006 | P < 0.0001 | P < 0.0001 | P = 0.0006 | P < 0.0001b | |
| P = 1.0a | P = 0.003a | P < 0.004a | P = 0.3a | P = 1.0a | P = 0.005a | ||
| M4, 69 yrs, I (n = 15) | rs = 0.47 | rs = -0.17 | rs = -0.63 | rs = 0.83 | rs = 0.21 | rs = -0.20 | 23.1 ± 1.9 |
| P = 0.08 | P = 0.5 | P = 0.01 | P = 0.0001 | P = 0.5 | P = 0.5 | P < 0.0001b | |
| P = 0.2a | nra | P = 0.01a | P = 0.2a | nra | nra | ||
| M5, 77 yrs, M (n = 26) | rs = 0.28 | rs = -0.30 | rs = -0.59 | rs = 0.93 | rs = 0.46 | rs = -0.57 | 30.3 ± 2.7 |
| P = 0.2 | P = 0.1 | P = 0.002 | P < 0.0001 | P = 0.02 | P = 0.003 | P = 0.022b | |
| nra | nra | P = 0.03a | P = 0.1a | P = 0.1a | P = 0.09a | ||
| M6, 77 yrs, I (n = 30) | rs = 0.78 | rs = -0.41 | rs = -0.61 | rs = 0.94 | rs = 0.84 | rs = -0.67 | 26.3 ± 2.0 |
| P < 0.0001 | P = 0.02 | P = 0.0004 | P < 0.0001 | P < 0.0001 | P < 0.0001 | P < 0.0001b | |
| P = 1.0a | P = 0.005a | P < 0.001a | P = 0.05a | P = 0.2a | P = 0.03a | ||
| M7, 61 yrs, I (n = 11) | rs = 0.77 | rs = -0.16 | rs = -0.58 | rs = 0.43 | rs = 0.82 | rs = -0.92 | 24.2 ± 3.0 |
| P = 0.04 | P = 0.02 | P = 0.2 | P = 0.3 | P = 0.02 | P = 0.004 | P < 0.0001b | |
| P = 0.01a | P = 0.3a | P = 0.05a | nra | P = 0.005a | P = 0.001a | ||
| M8c, 73 yrs, M (n = 24) | rs = 0.38 | rs = 0.28 | rs = 0.24 | rs = 0.90 | rs = 0.47 | rs = 0.04 | 24.5 ± 1.7 |
| P = 0.07 | P = 0.2 | P = 0.2 | P = 0.005 | P = 0.03 | P = 0.8 | P < 0.0001b | |
| nra | nra | nra | P = 0.4a | P = 0.1a | nra | ||
| M9, 63 yrs, I (n = 13) | rs = 0.53 | rs = -0.36 | rs = -0.66 | rs = 0.68 | rs = 0.69 | rs = -0.62 | 21.6 ± 1.0 |
| P = 0.06 | P = 0.2 | P = 0.01 | P < 0.0001 | P = 0.009 | P = 0.003 | P < 0.0001b | |
| P = 0.1a | nra | P = 0.01a | P = 0.03a | P = 0.03a | P = 0.1a | ||
| M10, 63 yrs, M (n = 30) | rs = 0.51 | rs = -0.68 | rs = -0.39 | rs = 0.93 | rs = 0.49 | rs = -0.79 | 27.4 ± 1.8 |
| P = 0.004 | P = 0.0001 | P = 0.03 | P < 0.0001 | P = 0.008 | P < 0.0001 | P < 0.0001b | |
| P = 0.04a | P = 0.02a | P = 0.04a | P = 0.1a | P = 0.06a | P = 0.001a | ||
| M11, 63 yrs, I (n = 15) | rs = 0.59 | rs = -0.38 | rs = -0.85 | rs = 0.68 | rs = 0.88 | rs = -0.83 | 31.2 ± 1.7 |
| P = 0.02 | P = 0.2 | P = 0.0001 | P = 0.005 | P < 0.0001 | P = 0.0001 | P = 0.3b | |
| P = 0.06a | P = 0.05a | P = 0.01a | P = 0.02a | P = 0.03a | P = 0.002a | ||
| Women C282Y/C282Y | Iron vs. ferritin | Iron vs. transferrin | Ferritin vs. transferrin | Iron vs. TSAT | Ferritin vs. TSAT | Transferrin vs. TSAT | Transferrin, µmol/L |
|---|---|---|---|---|---|---|---|
| Spearman’s rank correlation coefficient (rs) was used. Serum transferrin values are presented as arithmetic mean ± standard deviation. aComparison with corresponding rs for the all-women control group (Table 1) (I = induction treatment; M = maintenance treatment; nr = not relevant). bComparison with corresponding transferrin values for the all-women control group (Table 1). cF6 and F8 differ by showing positive correlations between iron and/or ferritin vs. transferrin. TSAT: transferrin saturation; yrs: years; n: number of consecutive blood samples. | |||||||
| F1, 53 yrs, I + M (n = 38) | rs = 0.47 | rs = -0.35 | rs = -0.64 | rs = 0.93 | rs = 0.63 | rs = -0.59 | 22.7 ± 1.5 |
| P = 0.0003 | P = 0.032 | P < 0.0001 | P <0.0001 | P < 0.0001 | P = 0.0001 | P < 0.0001b | |
| P = 0.004a | P = 0.014a | P = 0.001a | P = 0.3a | P = 1.0a | P = 0.1a | ||
| F2, 53 yrs, M (n = 13) | rs = 0.85 | rs = -0.15 | rs = -0.31 | rs = 0.92 | rs = 0.86 | rs = -0.37 | 23.1 ± 1.5 |
| P = 0.0002 | P = 0.6 | P = 0.3 | P < 0.0001 | P = 0.0002 | P = 0.2 | P < 0.0001b | |
| P = 0.001a | nra | nra | P = 0.4a | P = 0.01a | nra | ||
| F3, 34 yrs, M (n = 10) | rs = 0.09 | rs = 0.39 | rs = -0.37 | rs = 0.92 | rs = 0.06 | rs = -0.37 | 25.7 ± 1.8 |
| P = 0.8 | P = 0.3 | P = 0.3 | P = 0.0002 | P = 0.9 | P = 0.3 | P = 0.0005b | |
| nra | nra | nra | P = 0.4a | nra | nra | ||
| F4, 34 yrs, M (n = 10) | rs = 0.22 | rs = -0.09 | rs = -0.13 | rs = 0.97 | rs = 0.19 | rs = -0.31 | 19.8 ± 0.4 |
| P = 0.5 | P = 0.8 | P = 0.7 | P < 0.0001 | P = 0.6 | P = 0.4 | P < 0.0001b | |
| nra | nra | nra | P = 0.07a | nra | nra | ||
| F5, 59 yrs, I (n = 30) | rs = 0.36 | rs = -0.21 | rs = -0.75 | rs = 0.89 | rs = 0.61 | rs = -0.51 | 23.8 ± 2.6 |
| P = 0.05 | P = 0.3 | P < 0.0001 | P < 0.0001 | P = 0.0003 | P = 0.004 | P < 0.0001b | |
| P = 0.0 | nr | P = 0.001a | P = 0.3a | P = 0.002a | P = 0.3a | ||
| F6c, 48 yrs, M (n = 15) | rs = 0.83 | rs = 0.06 | rs = 0.29 | rs = 0.77 | rs = 0.76 | rs = -0.11 | 25.3 ± 1.1 |
| P = 0.0001 | P = 0.6 | P = 0.4 | P = 0.0009 | P = 0.0001 | P = 0.7 | P < 0.0001b | |
| P = 0.001a | nra | nra | P = 0.04a | P = 0.002a | nra | ||
| F7, 70 yrs, I (n = 12) | rs = 0.52 | rs = -0.01 | rs = -0.31 | rs = 0.94 | rs = 0.56 | rs = -0.31 | 28.7 ± 1.5 |
| P = 0.08 | P = 0.9 | P = 0.3 | P < 0.0001 | P = 0.06 | P = 0.3 | P < 0.0001b | |
| P = 0.001a | nra | nra | P = 0.3a | P = 0.07a | nra | ||
| F8c, 63 yrs, M (n = 30) | rs = 0.40 | rs = 0.13 | rs = 0.43 | rs = 0.85 | rs = 0.18 | rs = -0.33 | 23.9 ± 1.6 |
| P = 0.03 | P = 0.5 | P = 0.02 | P < 0.0001 | P = 0.3 | P = 0.08 | P < 0.0001b | |
| P = 0.06a | nra | P = 0.0001a | P = 0.09a | P = 0.4a | P = 0.9a | ||
| F9, 54 yrs, M (n = 29) | rs = 0.34 | rs = -0.20 | rs = 0.49 | rs = 0.85 | rs = 0.18 | rs = -0.48 | 23.2 ± 1.2 |
| P = 0.07 | P = 0.3 | P = 0.008 | P < 0.0001 | P = 0.04 | P = 0.009 | P < 0.0001b | |
| P = 0.008a | nra | P = 0.004 | P = 0.09a | P = 0.4a | P = 0.4a | ||
| F10, 77 yrs, M (n = 30) | rs = 0.42 | rs = -0.42 | rs = -0.10 | rs = 0.87 | rs = 0.36 | rs = -0.57 | 26.6 ± 2.1 |
| P = 0.02 | P = 0.02 | P = 0.6 | P < 0.0001 | P = 0.05 | P = 0.0009 | P < 0.0001b | |
| P = 0.008a | P = 0.08 | nra | P = 0.2a | P = 0.1a | P = 0.2a | ||