Gastroenterology Research, ISSN 1918-2805 print, 1918-2813 online, Open Access
Article copyright, the authors; Journal compilation copyright, Gastroenterol Res and Elmer Press Inc
Journal website https://gr.elmerpub.com

Original Article

Volume 19, Number 2, April 2026, pages 85-99


A Novel Triple-Biomarker Score Predicts Mortality in Acute Pancreatitis

Figures

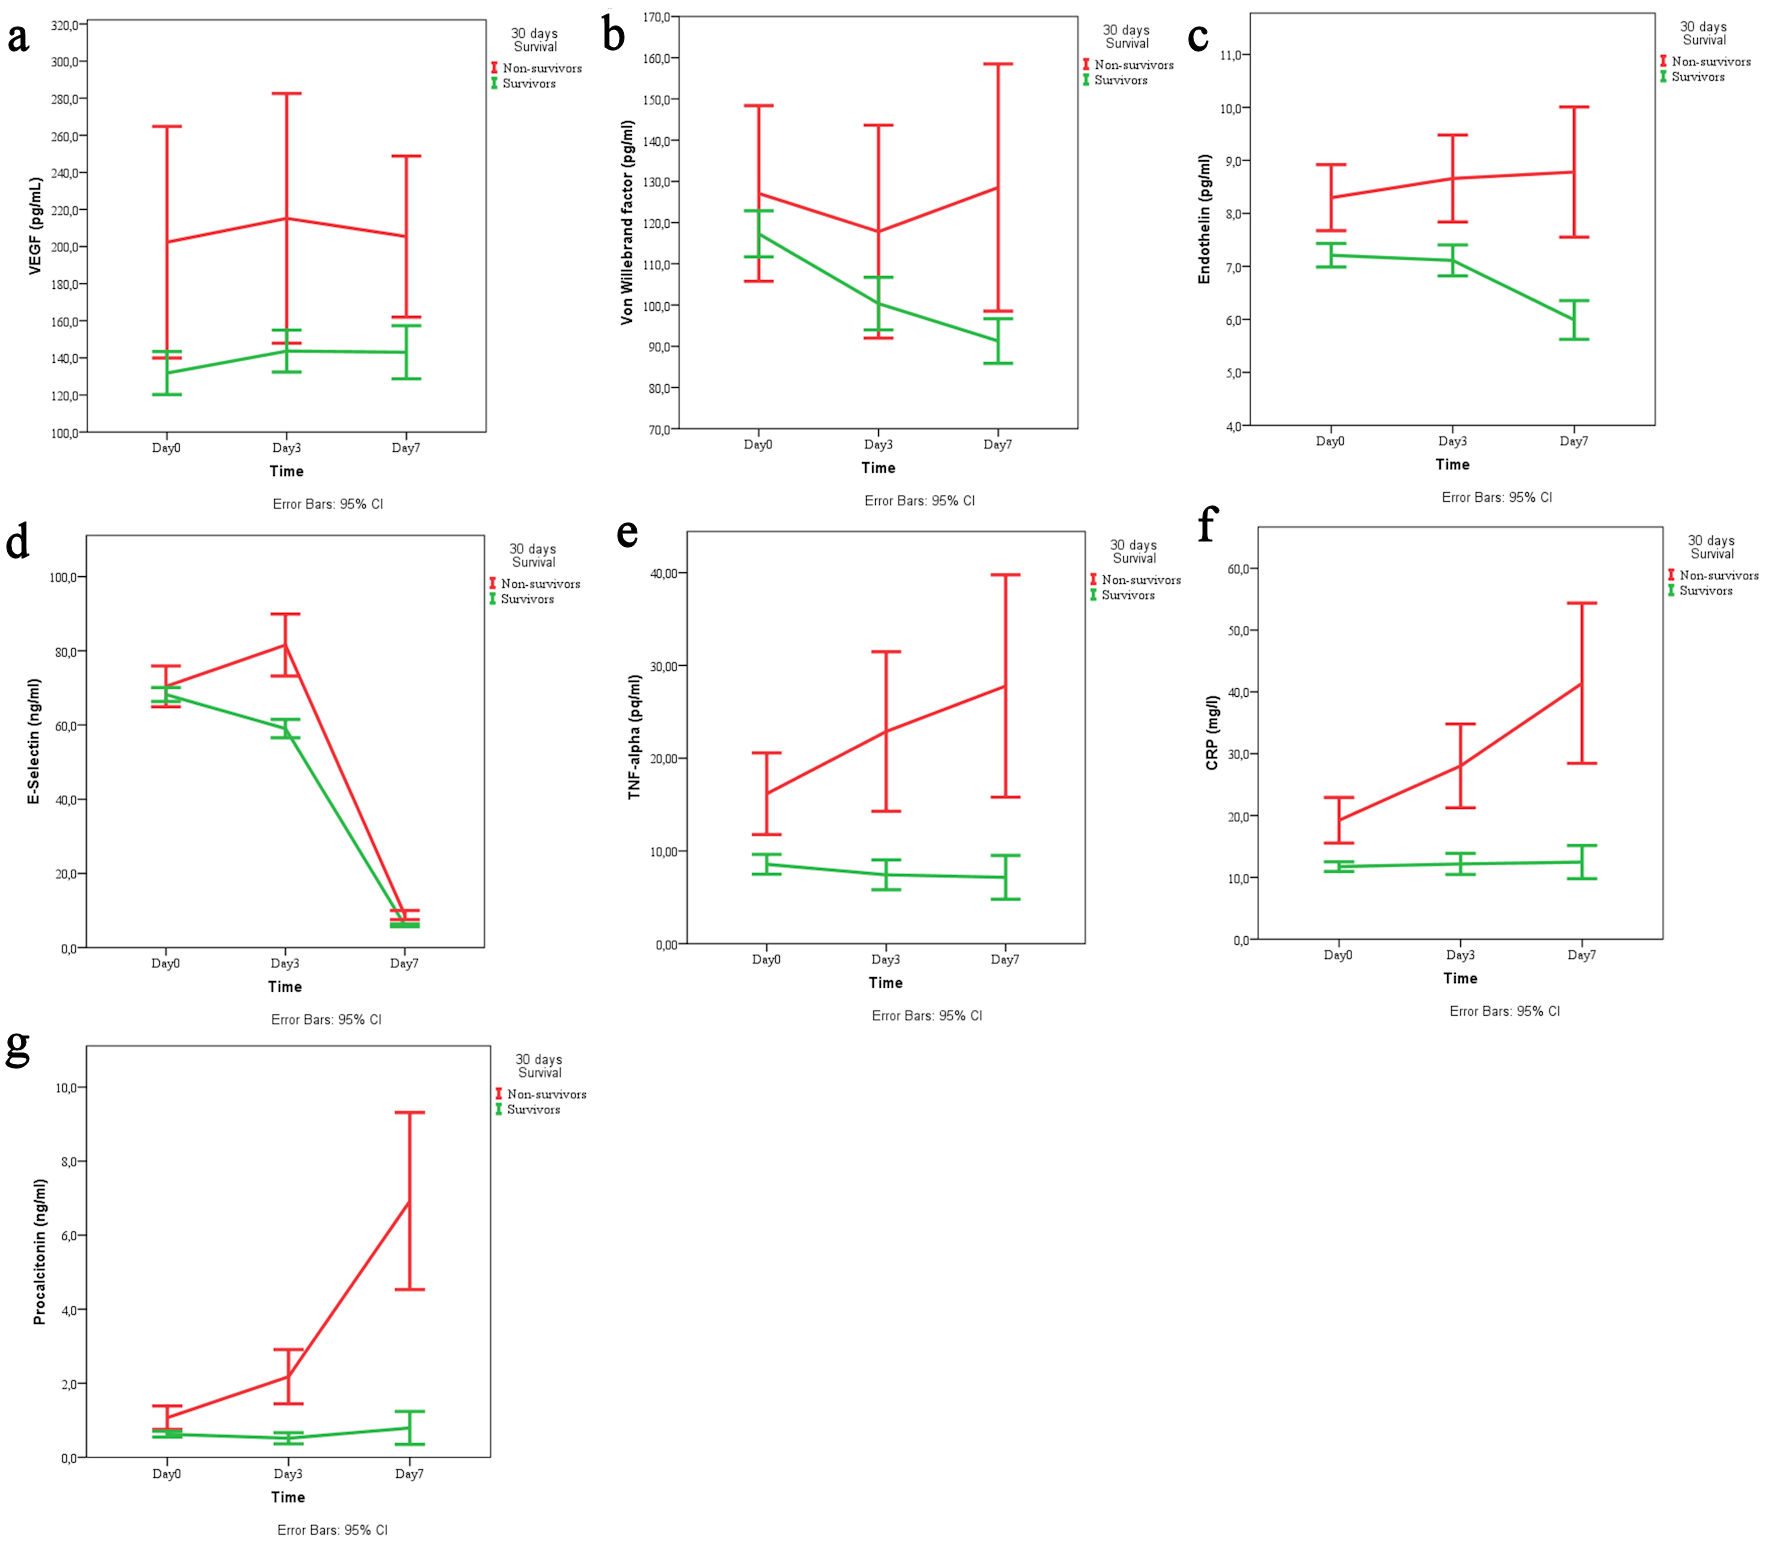
↓  Figure 1. Temporal trends of (a) VEGF, (b) von Willebrand factor, (c) endothelin, (d) E-selectin, (e) TNF-α, (f) CRP, and (g) procalcitonin across the three time points (day 1, 3, 7) stratified by survival status (survivors vs. non-survivors). VEGF: vascular endothelial growth factor; TNF-α: tumor necrosis factor-α; CRP: C-reactive protein; CI: confidence interval.
Figure 1.
↓  Figure 2. Box plots showing the distribution of TBS values between survivors and non-survivors. vWF: von Willebrand factor; TNF-α: tumor necrosis factor-α; TBS: triple biomarker score; CRP: C-reactive protein; CI: confidence interval.
Figure 2.
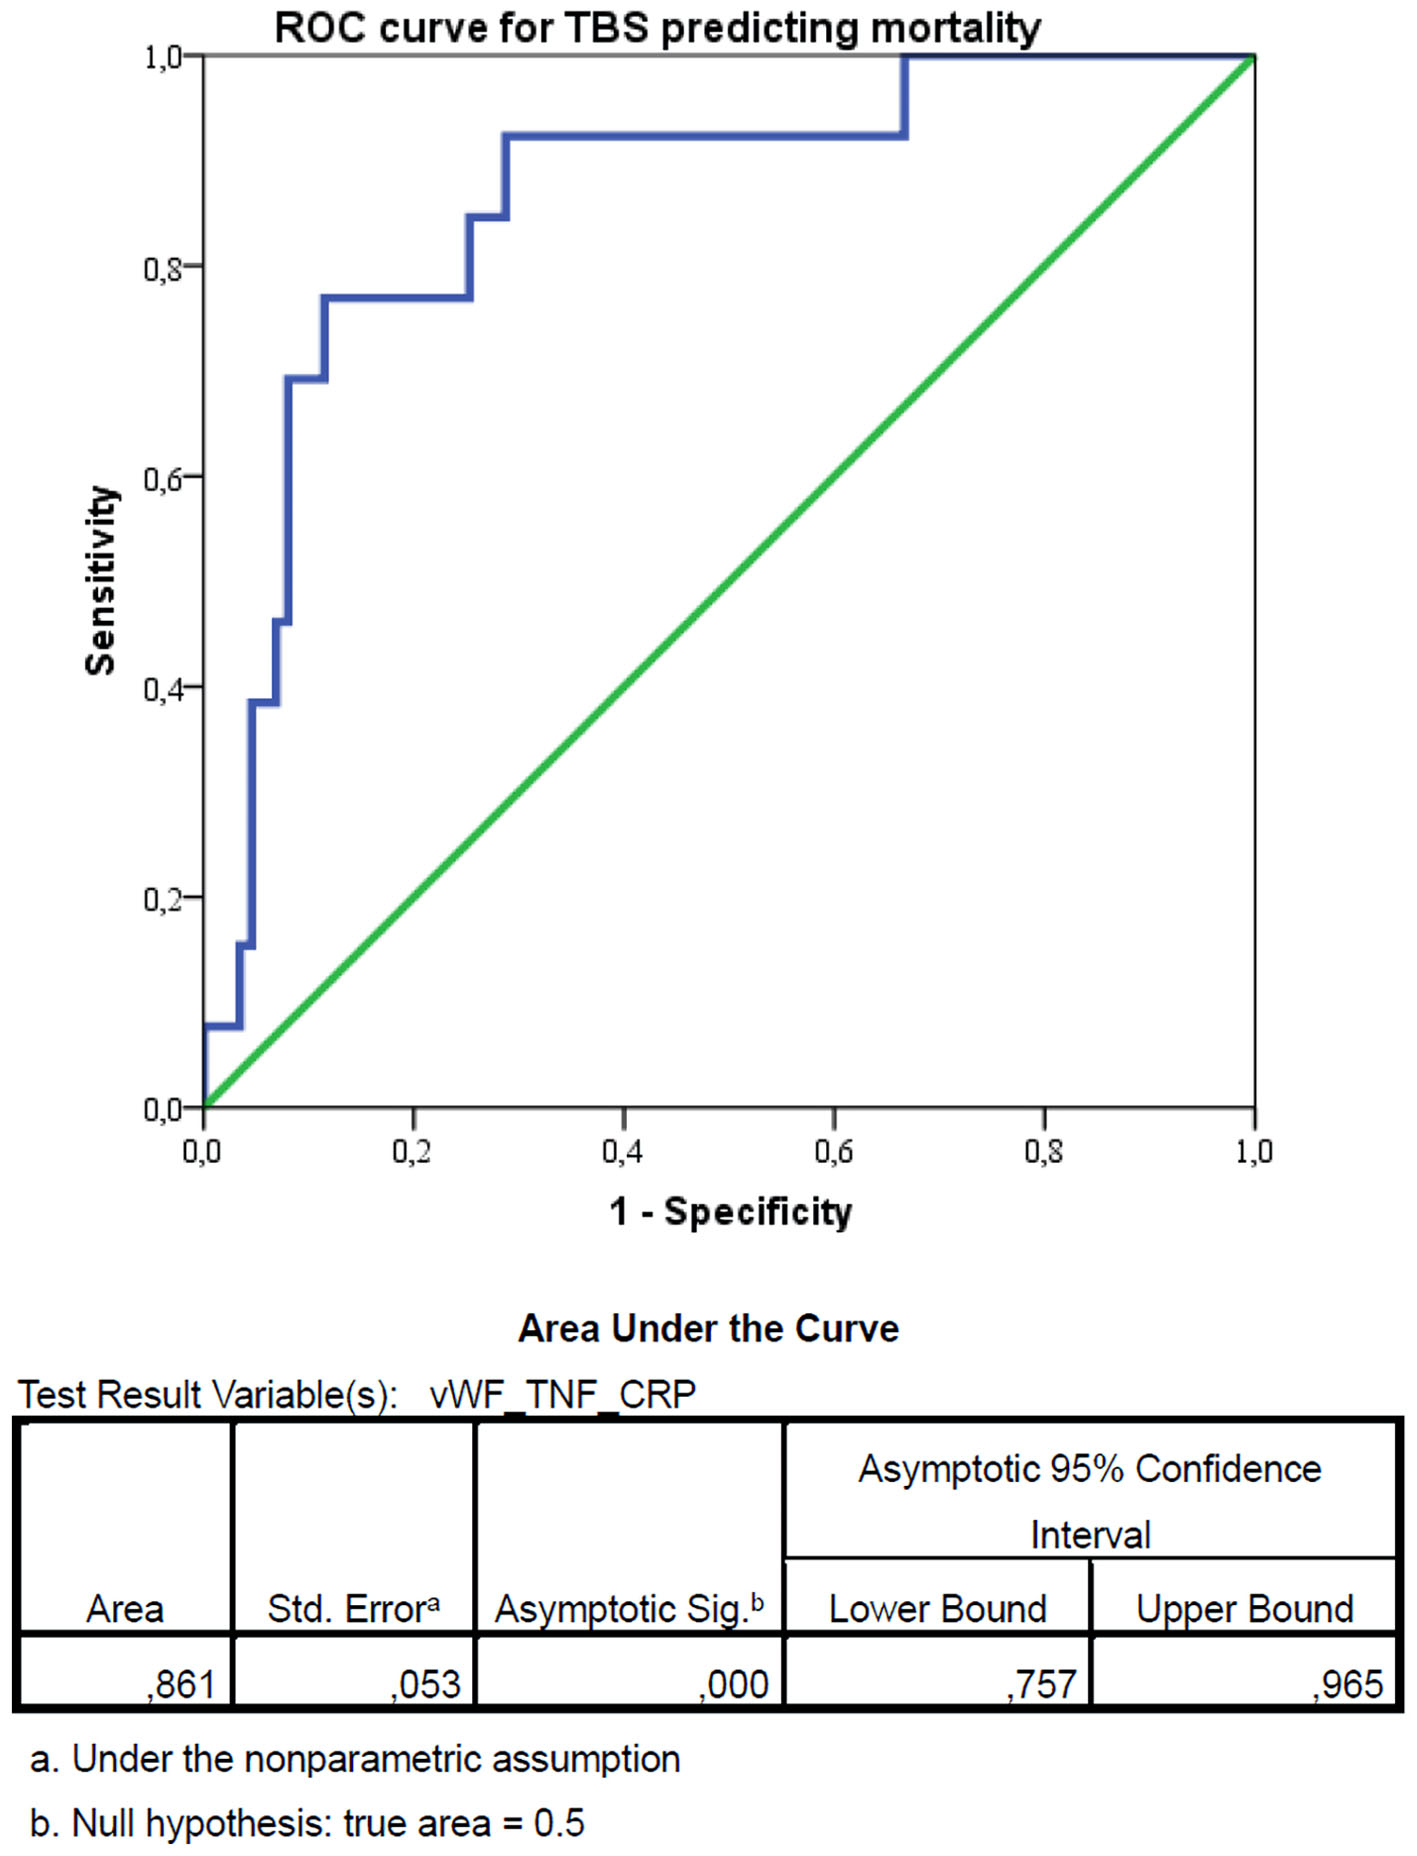
↓  Figure 3. Receiver operating characteristic (ROC) curve for the triple biomarker score (TBS) predicting in-hospital mortality. The optimal cut-off value was identified as 4952.65, using Youden’s index maximization, which yielded a sensitivity of 92.3% and a specificity of 69.0% (Youden’s index J = 0.613). vWF: von Willebrand factor; TNF-α: tumor necrosis factor-α; CRP: C-reactive protein; CI: confidence interval.
Figure 3.
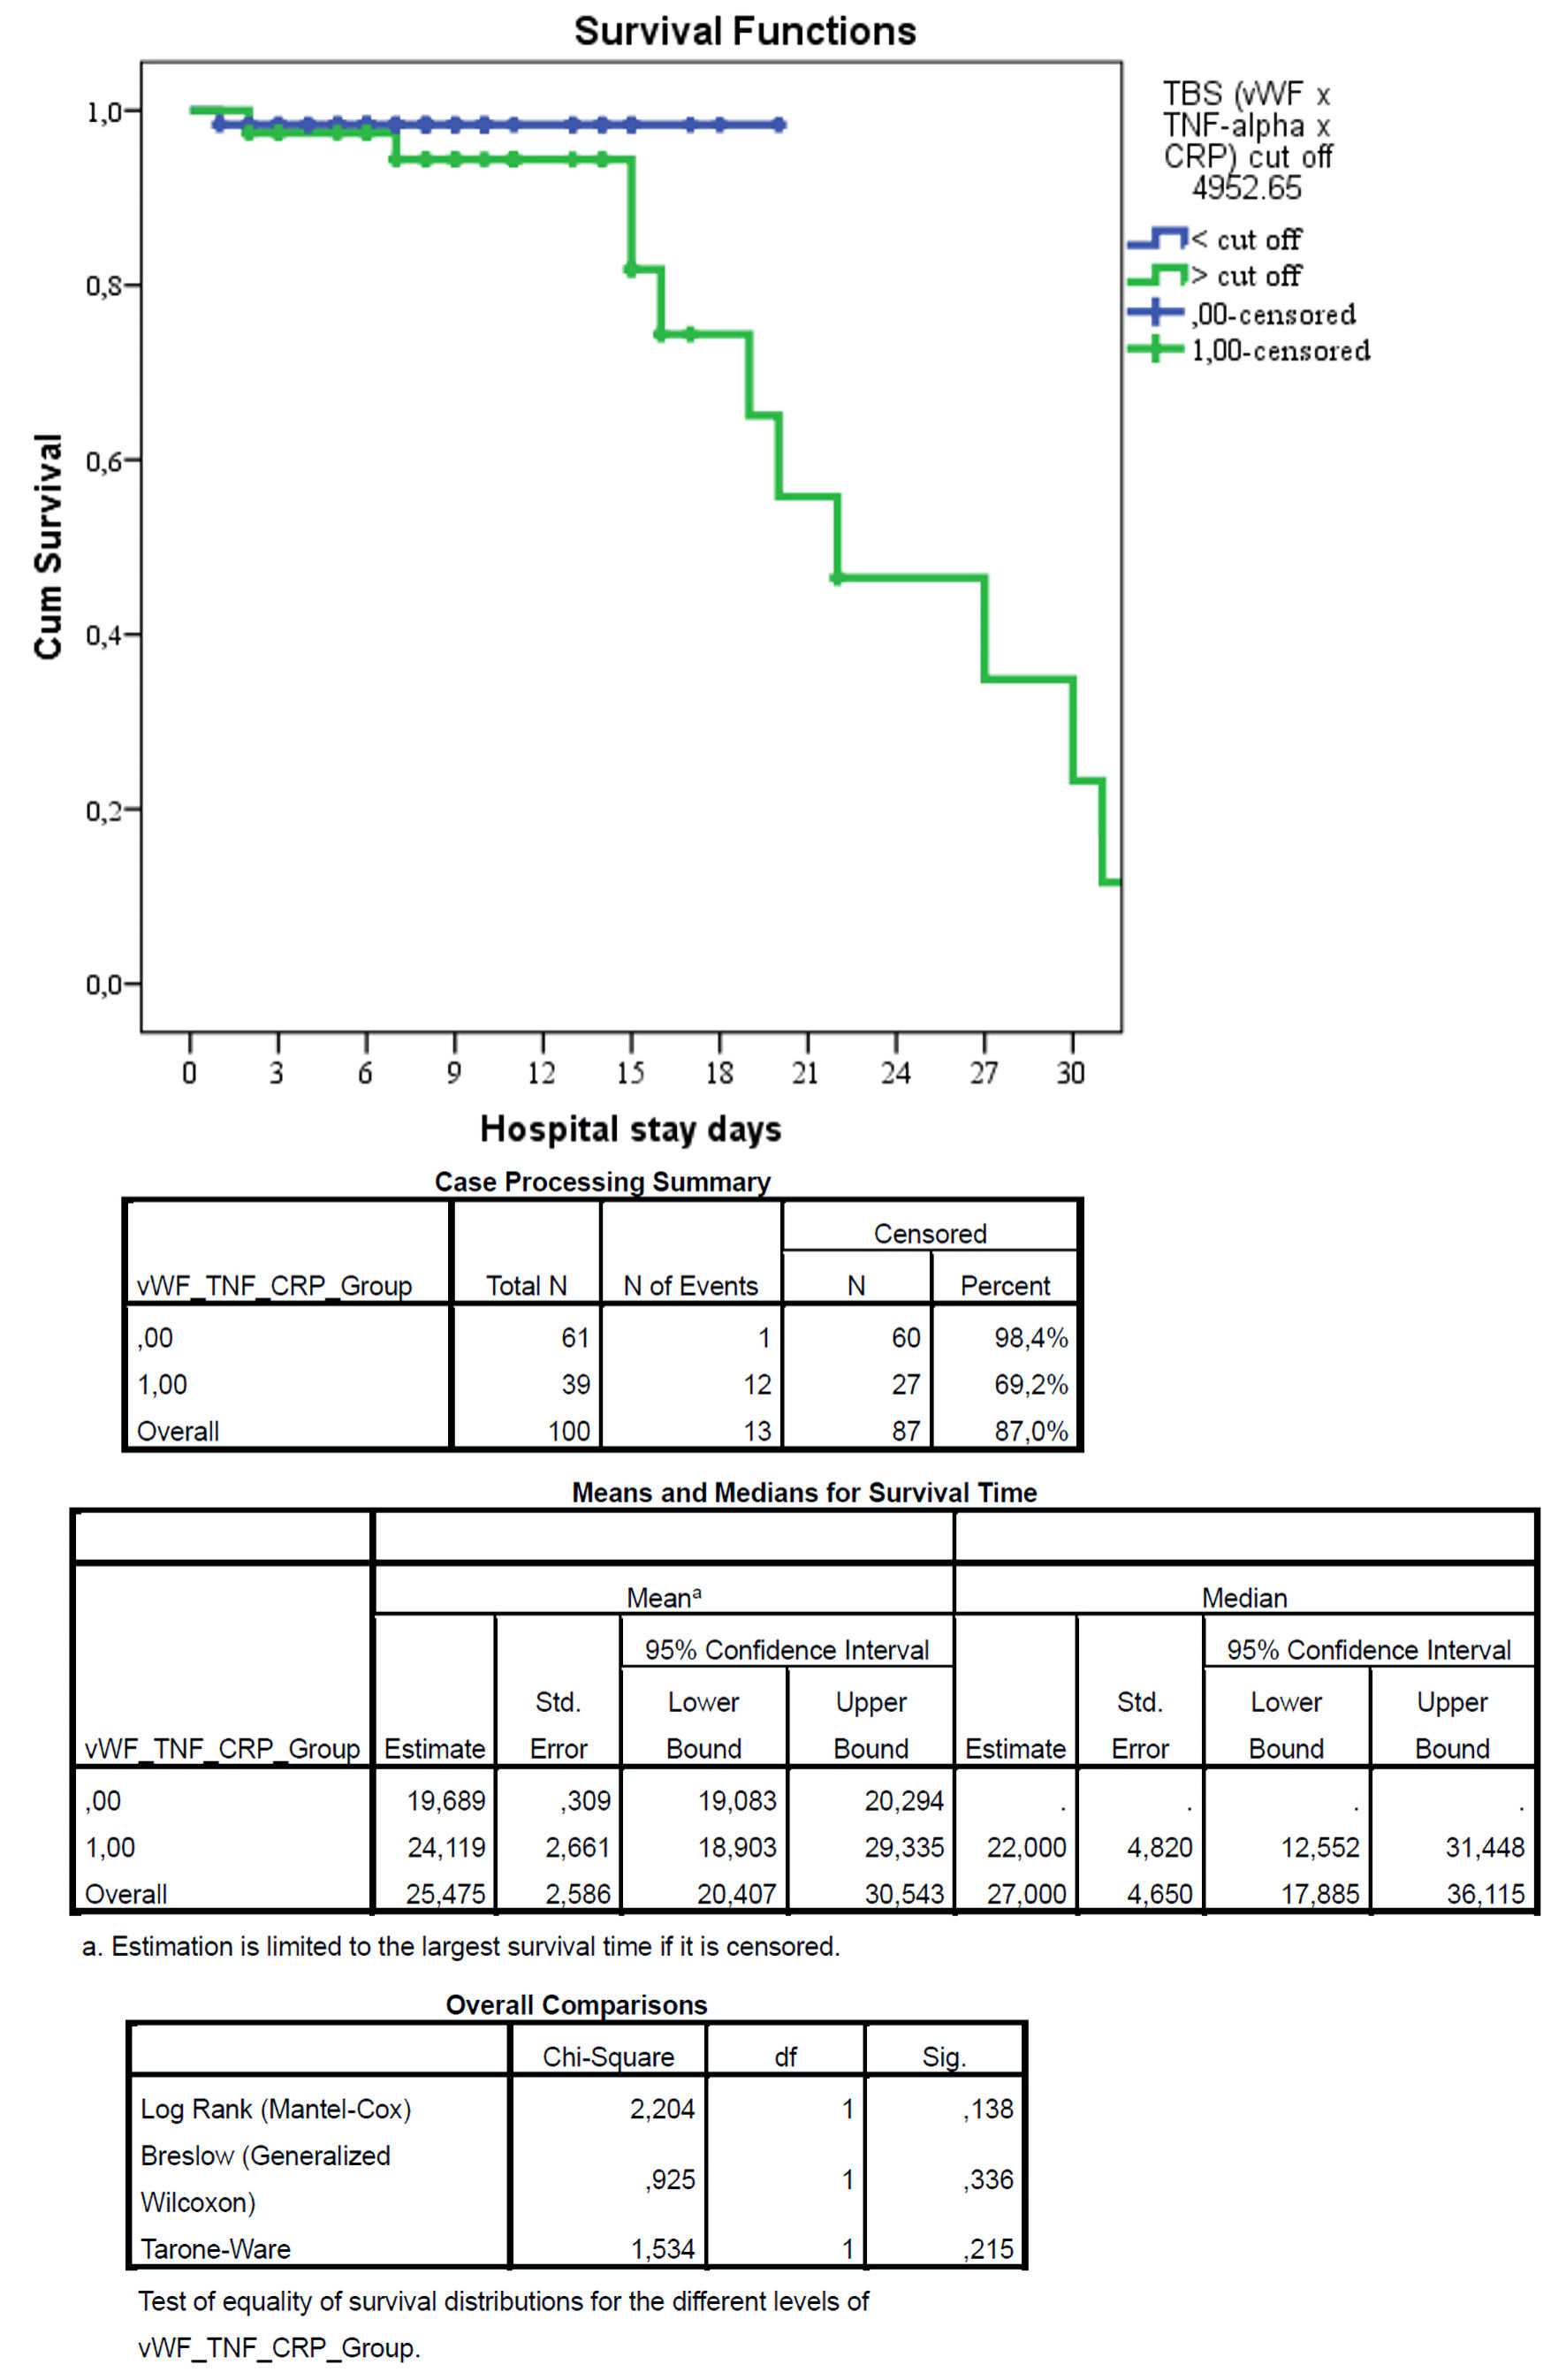
↓  Figure 4. Kaplan–Meier survival curves for patients stratified by triple biomarker score (TBS). Kaplan–Meier survival analysis demonstrated no statistically significant difference between groups (log-rank test: χ2 = 2.204, P = 0.138). Although mortality was numerically lower in group 0 compared to group 1, the difference did not reach statistical significance, likely due to the limited number of events. Censored patients are indicated by tick marks. The low TBS group had significantly higher survival (98.4%) compared to the high TBS group (69.2%), with a log-rank P value < 0.001. The table below shows the number of patients at risk at each time point.
Figure 4.

Tables

↓  Table 1. Specifications of Commercial Assay Kits Used for Biomarker Quantification
 
BiomarkerKit name (supplier)Catalog numberSample typeAssay typeDetection rangeSensitivity
All samples were collected, processed, and stored according to the manufacturers’ protocols and institutional ethical guidelines. Sensitivity values are given as the minimum detectable concentration according to the respective kit insert. For CRP, results are reported in both mg/dL and mg/L; conversion factor: 1 mg/dL = 10 mg/L. Catalog numbers and kit names correspond to the commercial products used at the time of the study. VEGF: vascular endothelial growth factor; vWF: von Willebrand factor; TNF-α: tumor necrosis factor-α; CRP: C-reactive protein; ELISA: enzyme-linked immunosorbent assay.
VEGFHuman VEGF165 ELISA Kit (Cloud-Clone Corp.)SEB696HuPlasmaSandwich ELISA15.6–1,000 pg/mL< 5.8 pg/mL
Endothelin-1Human Endothelin 1 ELISA Kit (Cloud-Clone Corp.)CEA482HuPlasmaSandwich ELISA6.17–500 pg/mL< 2.71 pg/mL
vWFHuman vWF ELISA Kit (Cloud-Clone Corp.)SEB696HuPlasmaSandwich ELISA15.6–1,000 pg/mL< 5.8 pg/mL
E-selectinHuman SELE ELISA Kit (Cloud-Clone Corp.)SEA029HuPlasmaSandwich ELISA39–2,500 pg/mL< 17 pg/mL
ProcalcitoninHuman PCT ELISA Kit (Cloud-Clone Corp.)SEA689HuPlasmaSandwich ELISA31.2–2,000 pg/mL< 12.4 pg/mL
TNF-αHuman TNF-α ELISA Kit (Vector-Best)VE-ELH-TNFaSerumSandwich ELISA15.6–1,000 pg/mL< 5.0 pg/mL
CRPCRP LATEX Kit (Monlab Reagents)3100SerumLatex turbidimetric immunoassay0.2–20 mg/dL (2–200 mg/L)< 0.2 mg/dL (2 mg/L)


↓  Table 2. Patient Characteristics and Clinical Outcomes Stratified by Disease Severity
 
CharacteristicMild course group (n = 68)Severe course group (n = 32)Subgroup A: worsened (n = 17)Subgroup B: improved (n = 15)
SD: standard deviation; IQR: interquartile range; BMI: body mass index; ICU: intensive care unit.
Age, years, mean ± SD (range)48.0 ± 12.5 (19–82)49.5 ± 11.8 (16–79)50.0 ± 10.1 (26–79)49.0 ± 13.8 (16–75)
Male sex, n (%)30 (44.1)16 (50.0)8 (47.1)8 (53.3)
Weight, kg, mean ± SD (range)77.0 ± 15.0 (37–111)79.0 ± 12.5 (53–106)80.0 ± 10.5 (55–95)78.0 ± 14.5 (53–106)
Height, cm, mean ± SD (range)166.0 ± 8.5 (144–189)163.5 ± 7.5 (147–178)163.0 ± 8.0 (147–175)164.0 ± 7.0 (156–178)
BMI, kg/m2, mean ± SD (range)27.0 ± 4.5 (22–37)29.5 ± 5.5 (22–44)30.0 ± 5.0 (24–41)29.0 ± 6.0 (22–44)
Hospital stay, days, mean ± SD (range)8.56 ± 5.37 (1–31)14 ± 7.83 (3–42)18.53 ± 8.16 (7–42)8.87 ± 2.56 (3–13)
ICU stay, days, mean ± SD (range)1.62 ± 1.42 (1–6)7.30 ± 8.60 (1–42)9.81 ± 10.33 (1–42)3.64 ± 2.73 (1–9)
Time from onset of symptoms to admission, days
  Mean ± SD136.35 ± 19.6855.69 ± 19.0561.59 ± 29.5149 ± 24.08
  Median309714
  IQR358252567
Complications, n (%)
  Pancreatic necrosis3 (4.41%)9 (28.12%)6 (35.29%)3 (20%)
  Pseudocyst3 (4.41%)3 (9.37%)1 (5.88%)2 (13.3%
  Infected necrosis10 (14.7%)13 (40.62%)8 (47.05%)5 (53.3%)
  Organ failure8 (11.76%)3 (9.37%)1 (5.88%)2 (13.3%)
Mortality, n (%)3 (4.4%)10 (31.3%)10 (58.8%)0 (0)


↓  Table 3. Correlation Matrix of Biomarkers on Admission (Adm) Day
 
Correlations
VEGF_AdmvWF_AdmEnd_AdmE-Sel_AdmTNF_AdmCRP_AdmProc_Adm
Data are presented as Spearman correlation coefficient (r). The diagonal of 1.0 represents the correlation of each variable with itself. **Correlation is significant at the 0.01 level (two-tailed). *Correlation is significant at the 0.05 level (two-tailed). VEGF: vascular endothelial growth factor; vWF: von Willebrand factor; TNF: tumor necrosis factor; CRP: C-reactive protein; End: endothelin-1; E-Sel: E-selectin; Proc: procalcitonin; Sig.: significance.
Spearman’s rhoVEGF_AdmCorrelation coefficient1.0000.0420.455**0.205*0.364**0.236*0.377**
Sig. (two-tailed)0.6810.0000.0410.0000.0180.000
N100100100100100100100
vWF_AdmCorrelation coefficient0.0421,0000.0390.177–0.0380.0940.192
Sig. (two-tailed)0.6810.7030.0780.7090.3540.056
N100100100100100100100
End_AdmCorrelation coefficient0.455**0.0391.0000.1690.684**0.429**0.598**
Sig. (two-tailed)0.0000.7030.0930.0000.0000.000
N100100100100100100100
E-Sel_AdmCorrelation coefficient0.205*0.1770.1691.0000.211*0.0640.299**
Sig. (two-tailed)0.0410.0780.0930.0350.5260.002
N100100100100100100100
TNF_AdmCorrelation coefficient0.364**–0.0380.684**0.211*1.0000.276**0.596**
Sig. (two-tailed)0.0000.7090.0000.0350.0050.000
N100100100100100100100
CRP_AdmCorrelation coefficient0.236*0.0940.429**0.0640.276**1.0000.433**
Sig. (two-tailed)0.0180.3540.0000.5260.0050.000
N100100100100100100100
Proc_AdmCorrelation coefficient0.377**0.1920.598**0.299**0.596**0.433**1.000
Sig. (two-tailed)0.0000.0560.0000.0020.0000.000
N100100100100100100100


↓  Table 4. Correlation Matrix of Biomarkers on Day 3 of Hospitalization
 
Correlations
VEGF_3dvWF_3dEnd_3dE-Sel_3dTNF_3dCRP_3dProc_3d
Data are presented as Spearman correlation coefficient (r). The diagonal of 1.0 represents the correlation of each variable with itself. **Correlation is significant at the 0.01 level (two-tailed). *Correlation is significant at the 0.05 level (two-tailed). 3d: day 3; VEGF: vascular endothelial growth factor; vWF: von Willebrand factor; TNF: tumor necrosis factor; CRP: C-reactive protein; End: endothelin-1; E-Sel: E-selectin; Proc: procalcitonin; Sig.: significance.
Spearman’s rhoVEGF_3dCorrelation coefficient1.0000.1810.328**0.426**0.277**0.333**0.238*
Sig. (two-tailed)0.0720.0010.0000.0050.0010.017
N100100100100100100100
vWF_3dCorrelation coefficient0.1811.0000.207*0.1370.255*0.262**0.209*
Sig. (two-tailed)0.0720.0380.1740.0110.0090.037
N100100100100100100100
End_3dCorrelation coefficient0.328**0.207*1.0000.402**0.696**0.562**0.722**
Sig. (two-tailed)0.0010.0380.0000.0000.0000.000
N100100100100100100100
E-Sel_3dCorrelation coefficient0.426**0.1370.402**1.0000.485**0.543**0.430**
Sig. (two-tailed)0.0000.1740.0000.0000.0000.000
N100100100100100100100
TNF_3dCorrelation coefficient0.277**0.255*0.696**0.485**1.0000.517**0.642**
Sig. (two-tailed)0.0050.0110.0000.0000.0000.000
N100100100100100100100
CRP_3dCorrelation coefficient0.333**0.262**0.562**0.543**0.517**1.0000.555**
Sig. (two-tailed)0.0010.0090.0000.0000.000.0.000
N100100100100100100100
Proc_3dCorrelation coefficient0.238*0.209*0.722**0.430**0.642**0.555**1.000
Sig. (two-tailed)0.0170.0370.0000.0000.0000.000
N100100100100100100100


↓  Table 5. Data for All Seven Biomarkers at Admission, Day 3, and Day 7, Stratified by the Three Clinically Relevant Subgroups (Mild Course, Worsened Subgroup A, Improved Subgroup B).
 
SubgroupsAdmissionDay 3Day 7
VEGFvWFEndE-SelTNFCRPProcVEGFvWFEndoE-SelTNFCRPProcVEGFvWFEndoE-SelTNFCRPProc
SD: standard deviation; Min: minimum; Max: maximum; VEGF: vascular endothelial growth factor; vWF: von Willebrand factor; TNF: tumor necrosis factor; CRP: C-reactive protein; End: endothelin-1; E-Sel: E-selectin; Proc: procalcitonin.
Mild course (n = 68)Mean120.1985116.01036.705067.23976.139410.81150.4509136.780993.93976.377556.40744.07319.61900.2140130.319186.04265.113747.91473.29998.69960.0896
N686868686868686868686868686868686868686868
SD37.2767122.641000.629508.721041.298622.671860.1668337.8591820.759350.467227.793020.837221.604390.0935941.1883917.145410.448076.578150.698961.280150.01165
Min35.0061.004.8035.304.126.980.1240.0059.004.0230.203.046.030.0650.4056.003.9325.402.515.980.05
Max260.00173.007.8279.2011.9615.200.91270.00165.807.2368.209.9713.960.42288.70154.006.1859.807.4012.030.11
Worsened (subgroup A, n = 17)Mean194.7706122.01188.912972.794117.557120.52941.3029209.7647136.07069.494787.352928.497134.92352.6853230.1529141.01189.937699.311837.552951.67068.3018
N171717171717171717171717171717171717171717
SD93.5745735.952070.299958.680835.156054.861810.3646796.2863045.883230.525478.132979.877006.666380.6786194.5694545.167450.930698.1830515.7791012.828031.91778
Min50.0066.308.3050.306.2010.000.5253.2059.008.7070.008.2020.200.6555.3077.008.6085.0015.0025.001.40
Max470.00176.009.2885.0028.0029.801.96508.00192.0010.60100.0040.0048.003.90520.00224.0011.50109.7062.0067.009.98
Improved (subgroup B, n = 15)Mean174.2200126.10678.503369.360015.912712.44671.0227161.9333104.00009.080758.346712.131311.72600.8533155.960090.84677.895345.32678.040710.20000.7820
N151515151515151515151515151515151515151515
SD88.6388636.383360.362338.321045.586832.723410.2870296.5406233.355830.555959.659703.648732.962590.1500385.0081722.180650.555755.888182.491352.587060.12712
Min46.0061.008.0046.006.108.000.5239.0059.008.2039.005.208.000.4038.0056.006.8035.004.007.800.40
Max460.00173.009.2078.0024.9020.001.60430.00166.009.9068.0019.0019.001.10415.00154.008.6261.0012.9018.000.98
TotalMean140.9790118.54507.350168.50209.546412.70880.6815152.9610102.61107.312961.95909.433914.23680.7300151.137096.10806.351056.26409.834016.22971.5895
N100100100100100100100100100100100100100100100100100100100100100
SD66.5395727.534621.099128.821135.914784.762980.4152867.3235332.146881.4587514.1019710.068179.962560.9619070.6311331.910121.9853120.7178214.2547516.993933.15873
Min35.0061.004.8035.304.126.980.1239.0059.004.0230.203.046.030.0638.0056.003.9325.402.515.980.05
Max470.00176.009.2885.0028.0029.801.96508.00192.0010.60100.0040.0048.003.90520.00224.0011.50109.7062.0067.009.98


↓  Table 6. Logistic Regression Analysis for Mortality Prediction
 
Variables in the equation
BSEWalddfSig.Exp(B)95% CI for EXP(B) (lower–upper)
aVariable(s) entered on step 1: TBS. Dependent variable: mortality (1 = died, 0 = survived). Model fit: Hosmer-Lemeshow χ2 = 6.21, df = 8, P = 0.62; Nagelkerke R2 = 0.51. TBS: triple biomarker score; SE: standard error; Sig.: significance; CI: confidence interval.
Step 1aTBS3.2831.0669.48110.00226.6673.298–215.586
Constant–4.0941.00816.48910.0000.017