Gastroenterology Research, ISSN 1918-2805 print, 1918-2813 online, Open Access
Article copyright, the authors; Journal compilation copyright, Gastroenterol Res and Elmer Press Inc
Journal website https://gr.elmerpub.com

Original Article

Volume 19, Number 2, April 2026, pages 74-84


A Supervised, Online, Home-Based Eccentric Resistance Exercise Program for Patients With Metabolic Dysfunction-Associated Steatotic Liver Disease

Figure

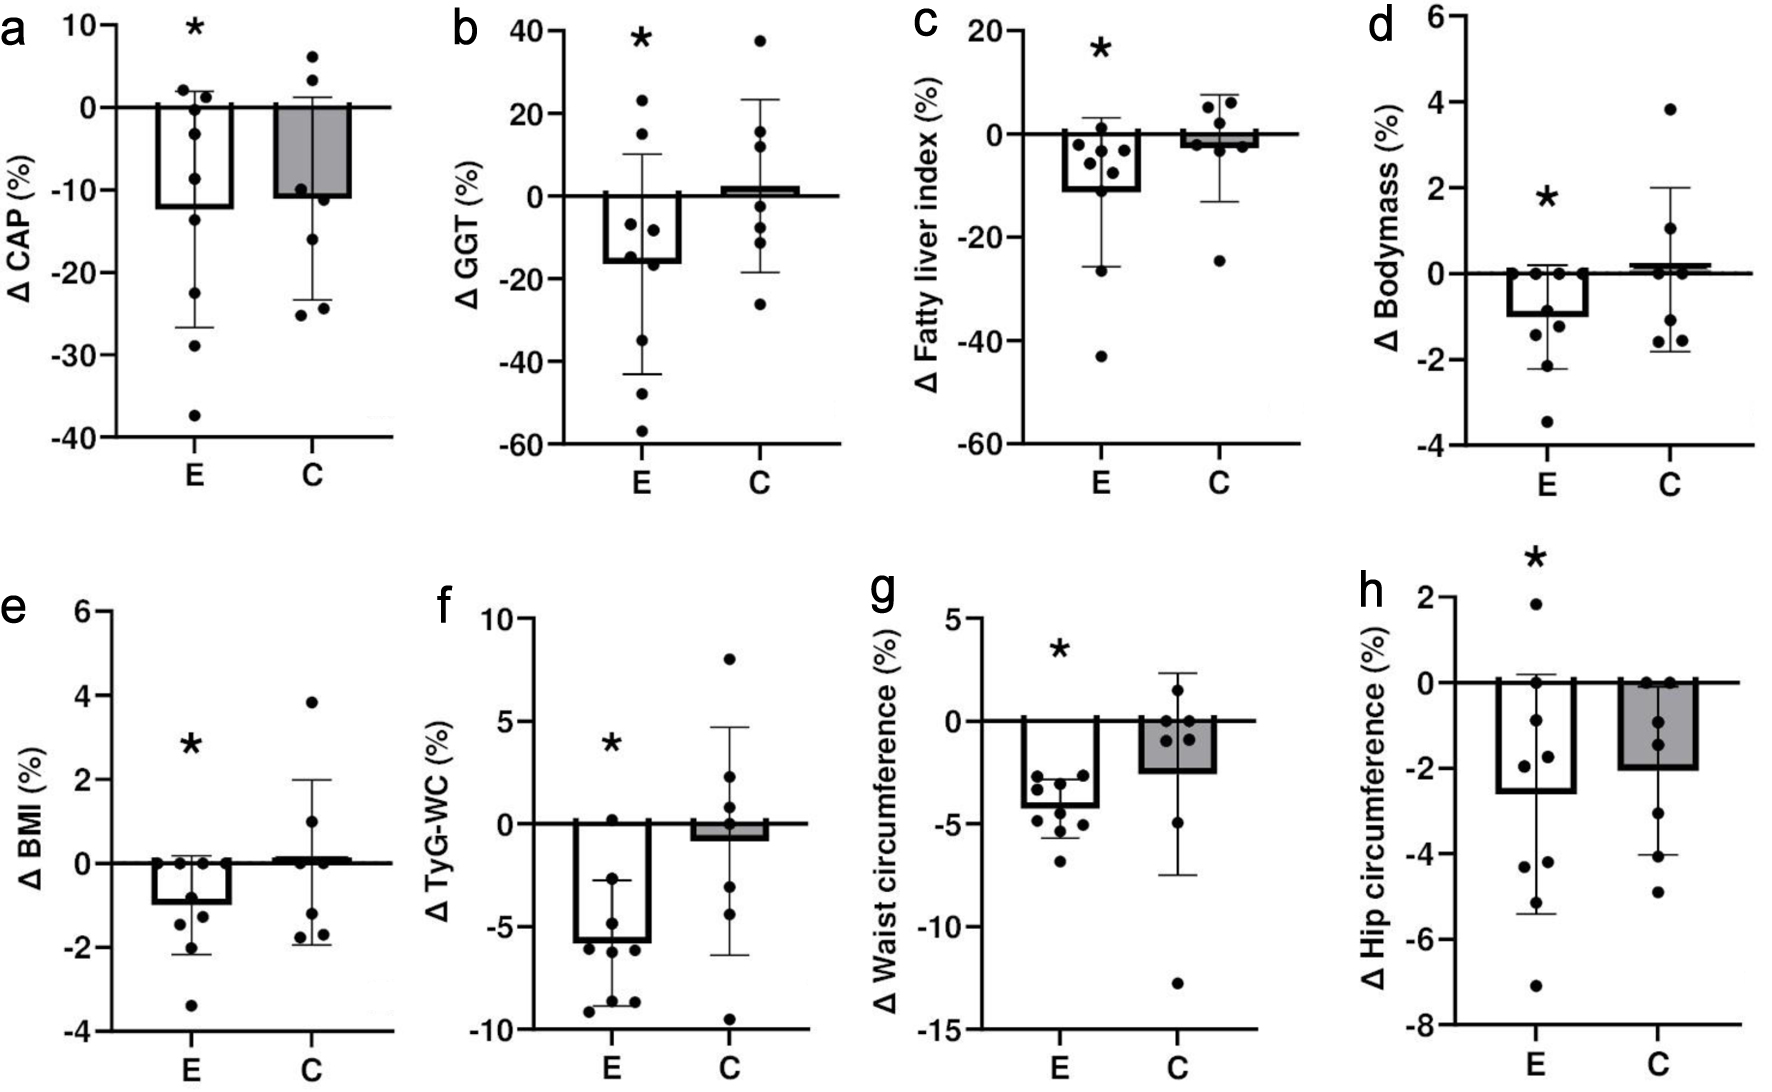
↓  Figure 1. Comparison between exercise (E) and control (C) groups for percent changes in (a) controlled attenuation parameter (CAP), (b) gamma-glutamyl transferase (GGT) activity, (c) fatty liver index, (d) body mass, (e) body mass index (BMI), (f) triglyceride glucose waist index (TyG-WC), (g) waist circumference, and (h) hip circumference from baseline to 8 weeks later. *A statistically significant within-group change from baseline (P < 0.05). The figure illustrates group trends and inter-individual variability; formal between-group comparisons were not statistically significant.
Figure 1.

Tables

↓  Table 1. Baseline Characteristics of Participants in the Exercise and Control Groups
 
Exercise groupControl groupP value
Values are expressed as mean ± SD along with the lowest-highest values of the participants or number of participants, and its percentage in the group participants. P value indicates the result of Mann–Whitney U test to compare between groups. *Significant (P < 0.05) difference between groups. BMI: body mass index; SD: standard deviation; TSI: Torres Strait Islander.
Age (years)57.4 ± 15.5 (26–78)47.4 ± 23.0 (24–91)0.22
Gender (male/female)5/43/40.62
Ethnicity (n, %)0.64
  Indian1 (11%)2 (29%)
  Asian2 (22%)-
  Caucasian5 (56%)3 (43%)
  African--
  Aboriginal & TSI1 (11%)-
  Others-2 (29%)
Body mass (kg)89.4 ± 13.0 (70–115)91.0 ± 32.5 (63–157)0.63
BMI (kg/m2)32.4 ± 4.5 (23.4–39.7)32.7 ± 6.4 (23.5–41.7)0.95
Diabetes mellitus (n, %)8 (89%)2 (29%)0.01*
Dyslipidemia (n, %)4 (44%)4 (57%)0.62
Steatosis grade (n, %)0.39
  S1--
  S21 (11%)2 (29%)
  S38 (89%)5 (71%)
Fibrosis grade (n, %)0.05
  F05 (56%)7 (100%)
  F13 (33%)-
  F21 (11%)-


↓  Table 2. Changes of Variables From Baseline to 8 Weeks Later for the Exercise (n = 9) and Control (n = 7) Groups
 
VariableGroupBaseline8-week
Values are expressed as mean ± standard deviation (SD), with ranges showing the lowest and highest values for each variable. *Significant (P < 0.05) difference from the baseline. Between-group differences are described in the Results text; table values reflect within-group changes only. ALT: alanine transaminase; AST: aspartate aminotransferase; BMI: body mass index; CAP: controlled attenuation parameter; Fib-4: fibrosis-4 index; FLI: fatty liver index; GGT: gamma-glutamyl transferase; HbA1c: glycosylated hemoglobin; HDL: high-density lipoprotein; HOMA-IR: homeostasis model assessment of insulin resistance; LDL: low-density lipoprotein; LSM: liver stiffness measurement; TG: triglycerides; TyG-WC: triglyceride-glucose waist circumference index; WC: waist circumference.
Body mass (kg)Exercise89.4 ± 13.0 (70–115)88.5 ± 13.1* (69–114)
Control91.0 ± 32.5 (63–157)91.5 ± 34.8 (62–163)
BMI (kg/m2)Exercise32.4 ± 4.5 (23.4–39.7)32.1 ± 4.5* (23.1–38.9)
Control32.7 ± 6.4 (23.5–41.7)32.8 ± 7.0 (23.1–43.3)
WC (cm)Exercise103.5 ± 10.2 (89–117)99.1 ± 9.6* (85–110)
Control104.0 ± 15.1 (85–133)101.5 ± 17.7 (82–135)
Hip circumference (cm)Exercise112.8 ± 9.1 (97–127)109.8 ± 8.5* (92–118)
Control117.0 ± 16.4 (98–139)114.7 ± 17.2* (95–139)
ALT (U/L)Exercise58.1 ± 36.9 (22–146)51.0 ± 42.2 (19–153)
Control55.1 ± 32.0 (12–109)49.4 ± 41.2 (19–141)
AST (U/L)Exercise39.6 ± 15.1 (21–64)37.3 ± 19.5 (21–80)
Control39.0 ± 13.5 (19–60)38.7 ± 19.2 (17–66)
GGT (U/L)Exercise62.7 ± 32.06 (20–115)47.7 ± 22.4* (23–78)
Control65.5 ± 83.0 (13–252)69.5 ± 94.4* (12–282)
Triglycerides (mmol/L)Exercise1.3 ± 0.4 (0.8–2.1)1.2 ± 0.3 (0.8–1.7)
Control1.3 ± 0.4 (0.9–2.2)1.5 ± 0.4 (0.9–1.9)
HDL (mmol/L)Exercise1.1 ± 0.1 (1–1.5)1.2 ± 0.2 (1.1–1.5)
Control1.1 ± 0.1 (0.9–1.4)1.18 ± 0.2 (1–1.5)
LDL (mmol/L)Exercise2.8 ± 0.9 (1.1–4.2)2.9 ± 0.9 (1.5–4.3)
Control2.5 ± 0.6 (1.8–3.5)2.6 ± 0.8 (1.6–4.2)
Glucose (mmol/L)Exercise7.7 ± 3.6 (5.1–17.1)7.1 ± 3.0 (4.9–14.4)
Control5.2 ± 0.4 (4.7–6.1)5.2 ± 0.5 (4.7–6.0)
Insulin (mIU/L)Exercise13.1 ± 4.6 (7–23)12.2 ± 5.8 (4–20)
Control12.5 ± 6.7 (4–24)9.8 ± 4.4 (4–16)
HOMA-IRExercise3.8 ± 1.4 (2.1–6.7)3.4 ± 2.2 (1.1–8.0)
Control3.0 ± 1.8 (0.8–6.5)2.3 ± 1.1 (0.8–4.1)
HbA1c (%)Exercise6.7 ± 1.8 (5.4–11.2)6.6 ± 1.8 (5.2–11.2)
Control5.7 ± 0.5 (4.7–6.2)5.6 ± 0.3 (5.0–6.0)
CAP (dB/m)Exercise342 ± 28.2 (300–388)297.1 ± 37.7* (243–341)
Control327.8 ± 23.7 (305–376)292.4 ± 53.6 (243–399)
LSM (kPa)Exercise5.9 ± 1.6 (3.5–8.3)5.4 ± 1.08 (4.1–7.7)
Control5.3 ± 1.1 (3–6.6)5.9 ± 1.0 (4.9–7.3)
TyG-WCExercise498.6 ± 63.7 (412–614)469.3 ± 57.9* (392–561)
Control481.4 ± 65.6 (395–599)479.0 ± 85.4 (399–647)
FLIExercise78.7 ± 17.6 (45–95)70.6 ± 21.9* (37–93)
Control75.8 ± 22.3 (33–97)73.8 ± 23.9 (35–99)
Fib-4 indexExercise1.3 ± 0.7 (0.6–2.5)1.3 ± 0.7 (0.5–2.5)
Control1.0 ± 0.9 (0.4–3.0)1.19 ± 1.2 (0.3–3.9)


↓  Table 3. Changes of Variables From Baseline to After 8-Week Training (Post-Training) for the Exercise Group
 
VariableBaselinePost-training
Values are expressed as mean ± standard deviation (SD) of nine participants and their lowest and highest values in the brackets. *Significant (P < 0.05) difference from the baseline value.
2-min step (n)86.3 ± 13.0 (56–98)118.7 ± 15.7* (79–134)
Sit-to-stand (n)14.8 ± 2.5 (12–19)18.4 ± 4.2* (11–25)
Single-leg balance (s)39.7 ± 24.4 (7–60)49.7 ± 15.2* (23–60)
Hand grip (kg)40 ± 16.4 (19–63)40.1 ± 16.5 (20–66)
Timed up and go (s)6.4 ± 0.6 (5.3–7.5)5.4 ± 0.9* (4.6–7.3)