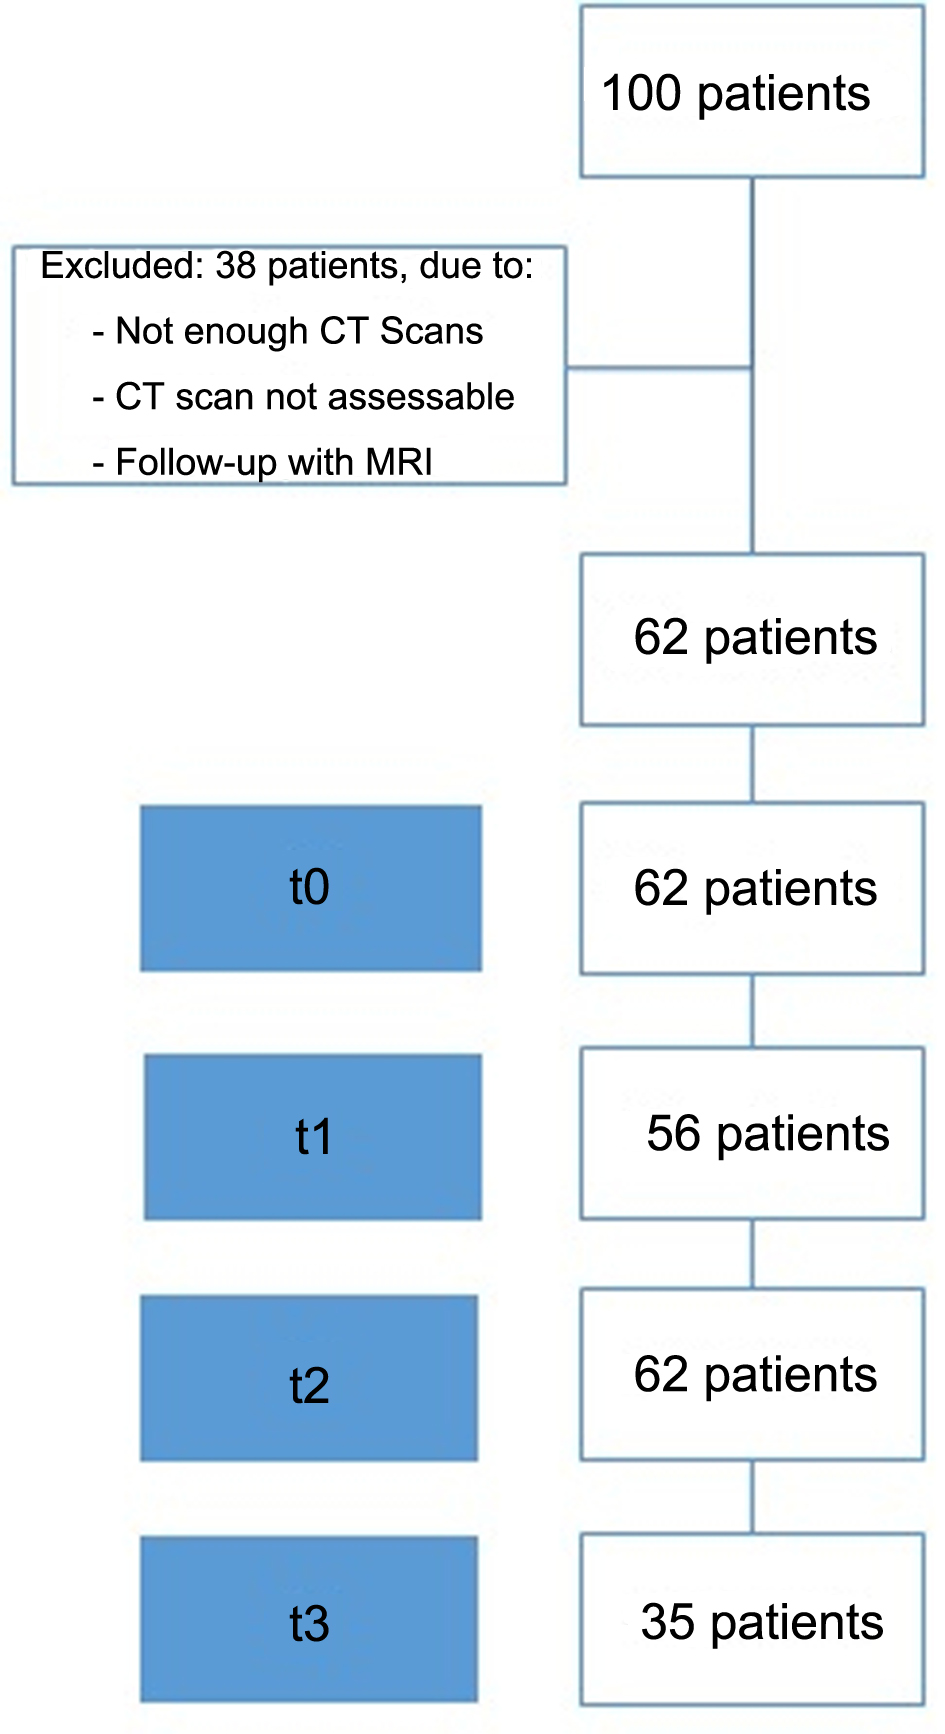
↓ Figure 1. Patient recruitment for the study cohort.
| Gastroenterology Research, ISSN 1918-2805 print, 1918-2813 online, Open Access |
| Article copyright, the authors; Journal compilation copyright, Gastroenterol Res and Elmer Press Inc |
| Journal website https://gr.elmerpub.com |
Original Article
Volume 19, Number 3, June 2026, pages 136-146
Computed Tomography-Based Assessment of Sarcopenia and Disease Progression in Pancreatic Ductal Adenocarcinoma: A Radiomics and Machine Learning Approach
Figures
Tables
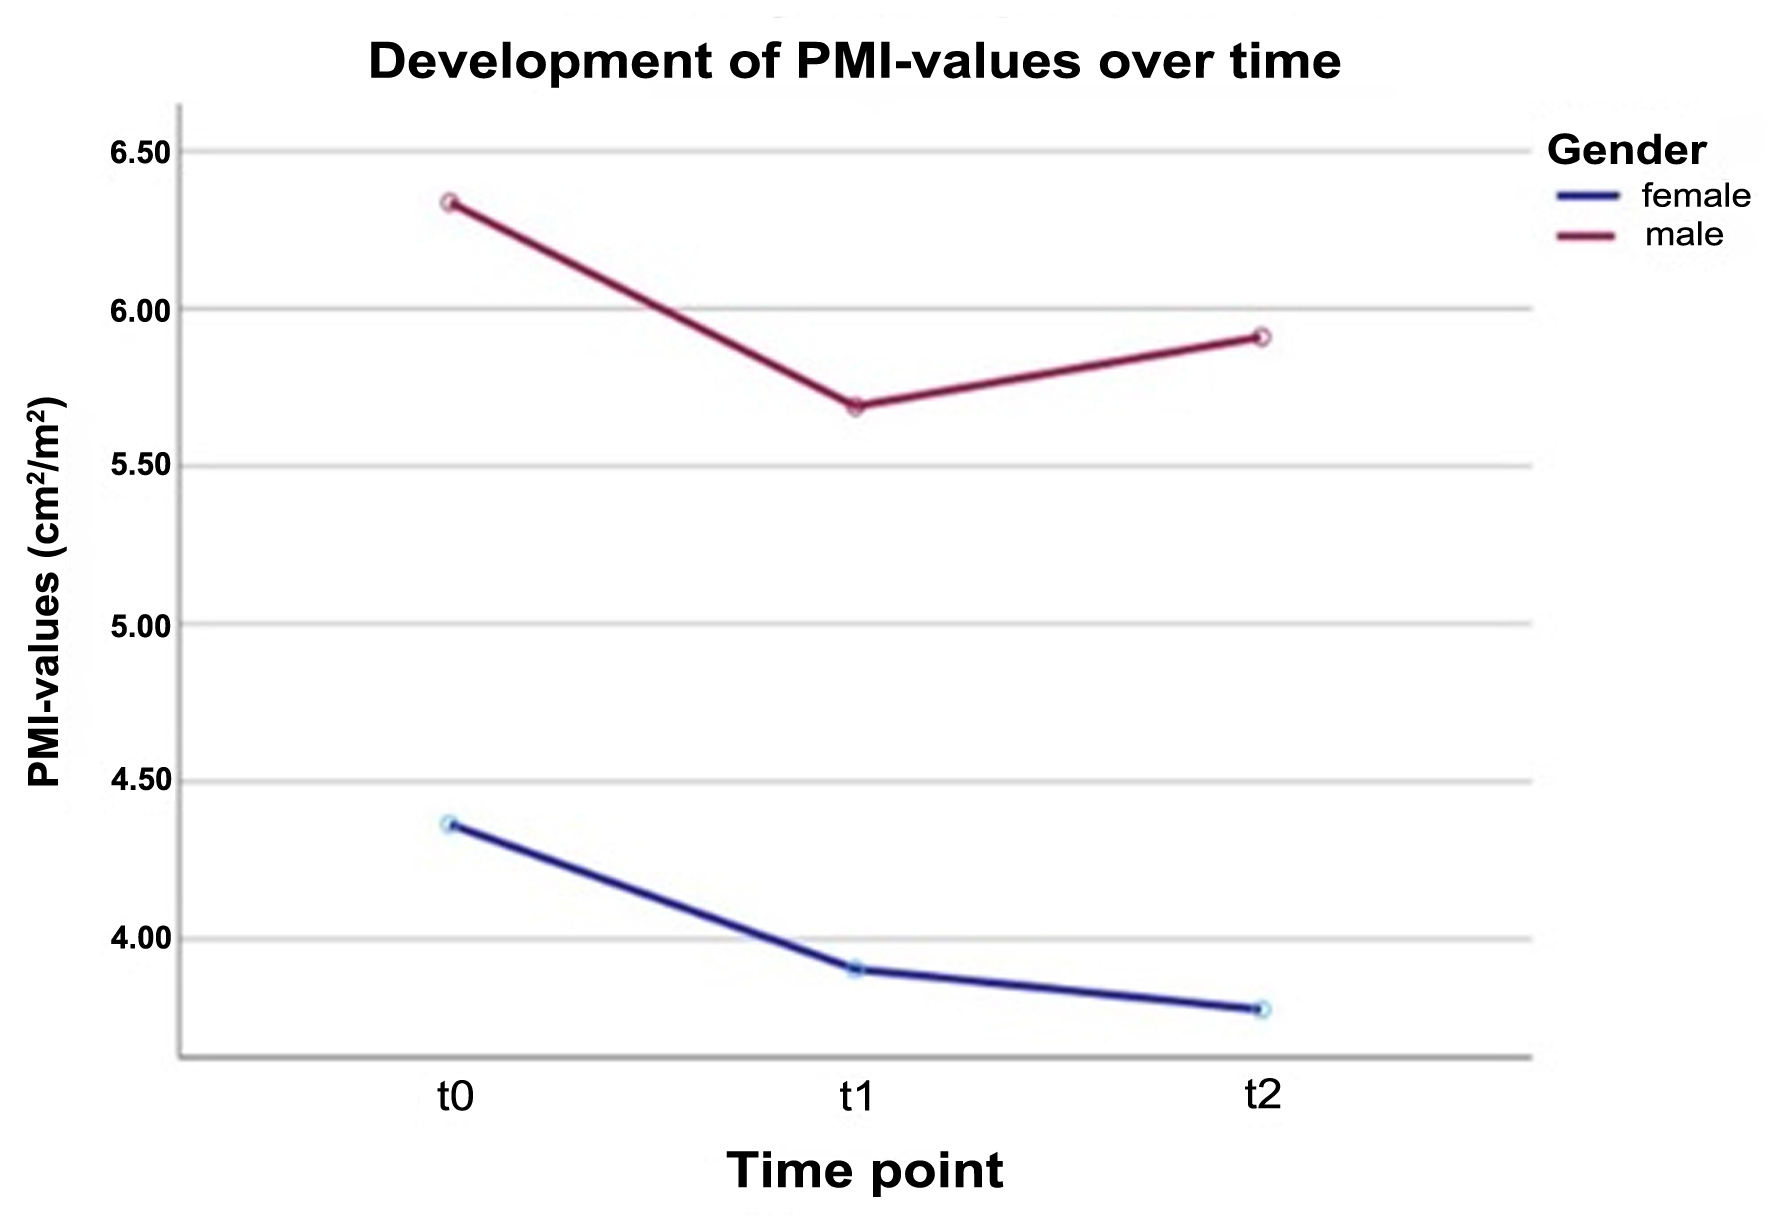
| Time points | PMI in cm2/m2, female | PMI in cm2/m2, male |
|---|---|---|
| t0 | 3.6 | 5.0 |
| t1 | 3.4 | 4.6 |
| t2 | 3.1 | 4.7 |
| t3 | 3.4 | 4.5 |
| Setting | Determination |
|---|---|
| FBN: fixed bin number; LoG: Laplacian of Gaussian. | |
| Bin method | FBN |
| Bin amount | 32 |
| LoG filter | 0 |
| LoG sigma | 2 |
| Matrix aggregation | 3D average |
| Method | Directions |
| Resample filter | 1 |
| Resample spacing X | 1 |
| Resample spacing Y | 1 |
| Resample spacing Z | 1 |
| Second-order distance | 1 |
| Threshold filter | 0 |
| Absolute number | Relative (%) | |
|---|---|---|
| Number of patients | 62 | 100 |
| Sex | ||
| Female | 24 | 38.7 |
| Male | 38 | 61.3 |
| Mean age (years) | ||
| Total (min.–max.) | 64 (41–84) | |
| Female | 66 (52–79) | |
| Male | 63 (41–84) |
| Absolute number | Relative (%) | |
|---|---|---|
| Additional information about patients’ therapy and disease course is provided. The third column shows the corresponding relative frequencies of patients. T: primary tumor; N: lymph nodes; M: metastasis; UICC: Union Internationale Contre le Cancer; PD: progressive disease. | ||
| T stage | ||
| Tx | 2 | 3.2 |
| T0 | 0 | 0 |
| T1 | 3 | 4.8 |
| T2 | 16 | 25.8 |
| T3 | 35 | 56.5 |
| T4 | 6 | 9.7 |
| N stage | ||
| Nx | 10 | 16.1 |
| N0 | 5 | 8.1 |
| N1 | 45 | 72.6 |
| N2 | 2 | 3.2 |
| M stage | ||
| Mx | 3 | 4.8 |
| M0 | 26 | 41.9 |
| M1 | 33 | 53.2 |
| UICC-stadium | ||
| IA | 3 | 4.8 |
| IB | 2 | 3.2 |
| IIA | 0 | 0 |
| IIB | 16 | 25.8 |
| III | 5 | 8.1 |
| IV | 33 | 53.2 |
| Unknown | 3 | 4.8 |
| Therapy | ||
| Resection + chemotherapy | 18 | 29.0 |
| Resection only | 5 | 8.1 |
| Chemotherapy only | 39 | 62.9 |
| Disease course (n = 62) | ||
| 1 = no PD at t2 | 37 | 59.7 |
| 2 = PD at t2, no PD at t1 | 18 | 29.0 |
| 3 = PD at t2, PD at t1 | 7 | 11.3 |
| Disease course (n = 35) | ||
| 1 = no PD at t3 | 16 | 45.7 |
| 2 = PD at t3, no PD at t2 | 13 | 37.1 |
| 3 = PD at t3, PD at t2 | 6 | 17.1 |
| t0 | t1 | t2 | t3 | |||||
|---|---|---|---|---|---|---|---|---|
| Absolute | h (%) | Absolute | h (%) | Absolute | h (%) | Absolute | h (%) | |
| The percentage values marked with (*) refer, for better comparability, to the subset of the respective category that contained values. PMI: psoas muscle index; SD: standard deviation. | ||||||||
| Patients | 62 | 100 | 56 | 90.3 | 62 | 100 | 35 | 56.5 |
| PMI (cm2/m2), mean ± SD | ||||||||
| Total | 5.45 ± 1.65 | 5.05 ± 1.45 | 4.96 ± 1.69 | 5.05 ± 1.52 | ||||
| Female | 4.22 ± 0.78 | 3.90 ± 0.89 | 3.62 ± 0.80 | 3.87 ± 0.64 | ||||
| Male | 6.22 ± 1.59 | 5.69 ± 1.31 | 5.81 ± 1.55 | 5.59 ± 1.50 | ||||
| Sarcopenia according to lowest quartile | ||||||||
| Total | 16 | 25.8* | 14 | 25.0* | 16 | 25.8* | 9 | 25.7* |
| Female | 6 | 25.0* | 5 | 25.0* | 6 | 25.0* | 3 | 27.3* |
| Male | 10 | 26.3* | 9 | 25.0* | 10 | 26.3* | 6 | 25.0* |
| Sarcopenia according to reference values | ||||||||
| Total | 19 | 30.6* | 27 | 48.2* | 31 | 50.0* | 17 | 48.6* |
| Female | 7 | 29.2* | 10 | 50.0* | 15 | 62.5* | 5 | 45.5* |
| Male | 12 | 31.6* | 17 | 47.2* | 16 | 42.1* | 12 | 50.0* |
| t0 | t1 | t2 | t3 | |
|---|---|---|---|---|
| Acc: accuracy; CI: confidence interval; dt: decision tree; KNN: k-nearest neighbor; M: mean; rf: random forest; ROC-AUC: receiver operating characteristics area under the curve; SD: standard deviation. | ||||
| Acc_M_rf | 0.73 ± 0.05 | 0.76 ± 0.07 | 0.79 ± 0.12 | 0.72 ± 0.08 |
| Acc_95% CI_rf | 0.72–0.74 | 0.74–0.78 | 0.76–0.82 | 0.69–0.75 |
| Auc_M_rf | 0.81 ± 0.09 | 0.83 ± 0.07 | 0.84 ± 0.11 | 0.74 ± 0.14 |
| Auc_95% CI_rf | 0.79–0.83 | 0.81–0.85 | 0.81–0.87 | 0.69–0.79 |
| F1_M_rf | 0.53 ± 0.21 | 0.70 ± 0.13 | 0.75 ± 0.06 | 0.71 ± 0.10 |
| F1_95% CI_rf | 0.48–0.58 | 0.67–0.73 | 0.74–0.76 | 0.68–0.74 |
| Acc_M_KNN | 0.65 ± 0.08 | 0.45 ± 0.09 | 0.45 ± 0.08 | 0.47 ± 0.13 |
| Acc_95% CI_KNN | 0.63–0.67 | 0.43–0.47 | 0.43–0.47 | 0.43–0.51 |
| Auc_M_KNN | 0.58 ± 0.10 | 0.54 ± 0.09 | 0.54 ± 0.10 | 0.56 ± 0.20 |
| Auc_95% CI_KNN | 0.56–0.60 | 0.52–0.56 | 0.52–0.56 | 0.49–0.62 |
| F1_M_KNN | 0.47 ± 0.28 | 0.53 ± 0.13 | 0.73 ± 0.09 | 0.59 ± 0.13 |
| F1_95% CI_KNN | 0.40–0.54 | 0.50–0.56 | 0.71–0.75 | 0.55–0.63 |
| Acc_M_dt | 0.67 ± 0.07 | 0.66 ± 0.07 | 0.70 ± 0.05 | 0.76 ± 0.10 |
| Acc_95% CI_dt | 0.65–0.69 | 0.64–0.68 | 0.69–0.71 | 0.73–0.79 |
| Auc_M_dt | 0.68 ± 0.10 | 0.64 ± 0.07 | 0.72 ± 0.05 | 0.76 ± 0.10 |
| Auc_95% CI_dt | 0.66–0.70 | 0.62–0.66 | 0.71–0.73 | 0.73–0.79 |
| F1_M_dt | 0.31 ± 0.12 | 0.71 ± 0.14 | 0.55 ± 0.10 | 0.54 ± 0.12 |
| F1_95% CI_dt | 0.28–0.34 | 0.67–0.75 | 0.53–0.57 | 0.50–0.58 |