Figures
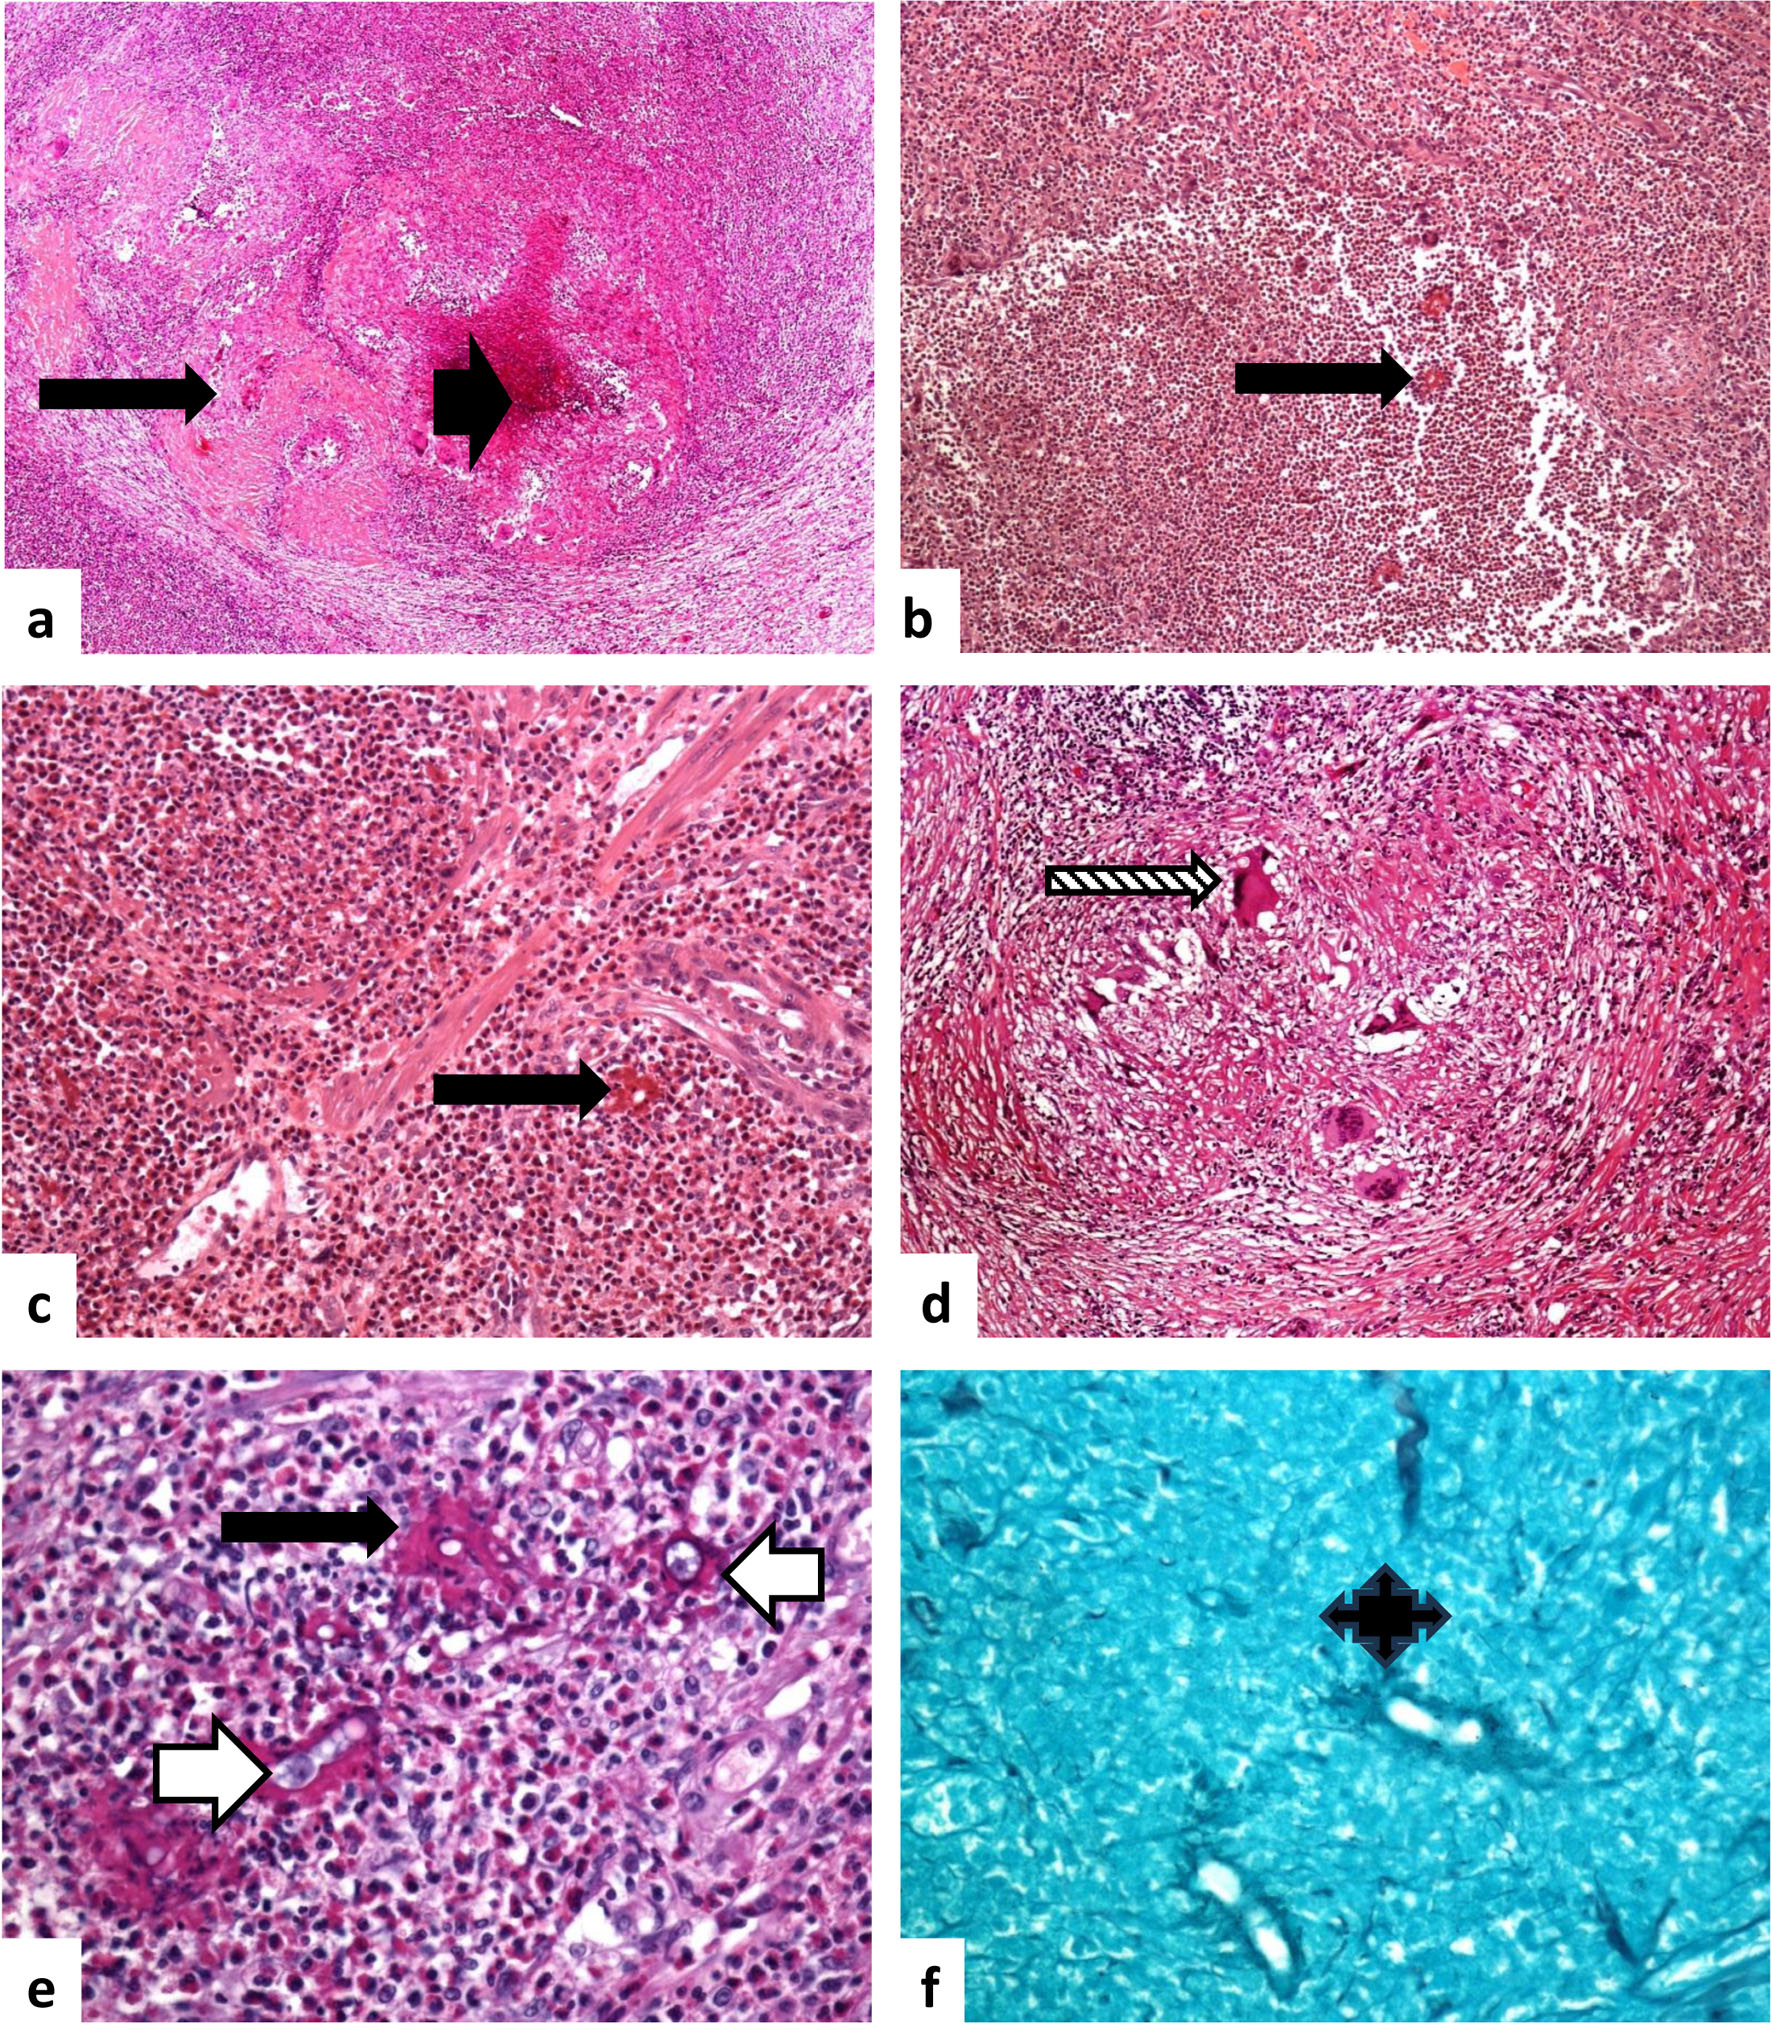
↓ Figure 1. Histological features of basidiobolomycosis. (a) Basidiobolomycosis involving the pericolic tissue and muscular layer of the colon, with extensive eosinophil-rich granulomatous inflammation. Multiple fungal hyphae are surrounded by sleeves of eosinophilic material (a: × 20, b: × 40, c: × 100, e: × 400; Splendore–Hoeppli phenomenon, long black arrow), along with areas of necrosis (a: short black arrow). Foreign-body giant cells with surrounding inflammatory reaction are present (d: ×200, patterned long arrow). The fungal elements display features similar to amoebic trophozoites, characterized by foamy cytoplasm and a prominent nucleolus without heterochromatin (e: white long arrow). (f) Gomori methenamine silver (GMS) staining highlights fungal hyphae, enhancing visualization of the fungal cell walls (quad arrow; × 400). Source of figure: Prof Dr. Hussein.
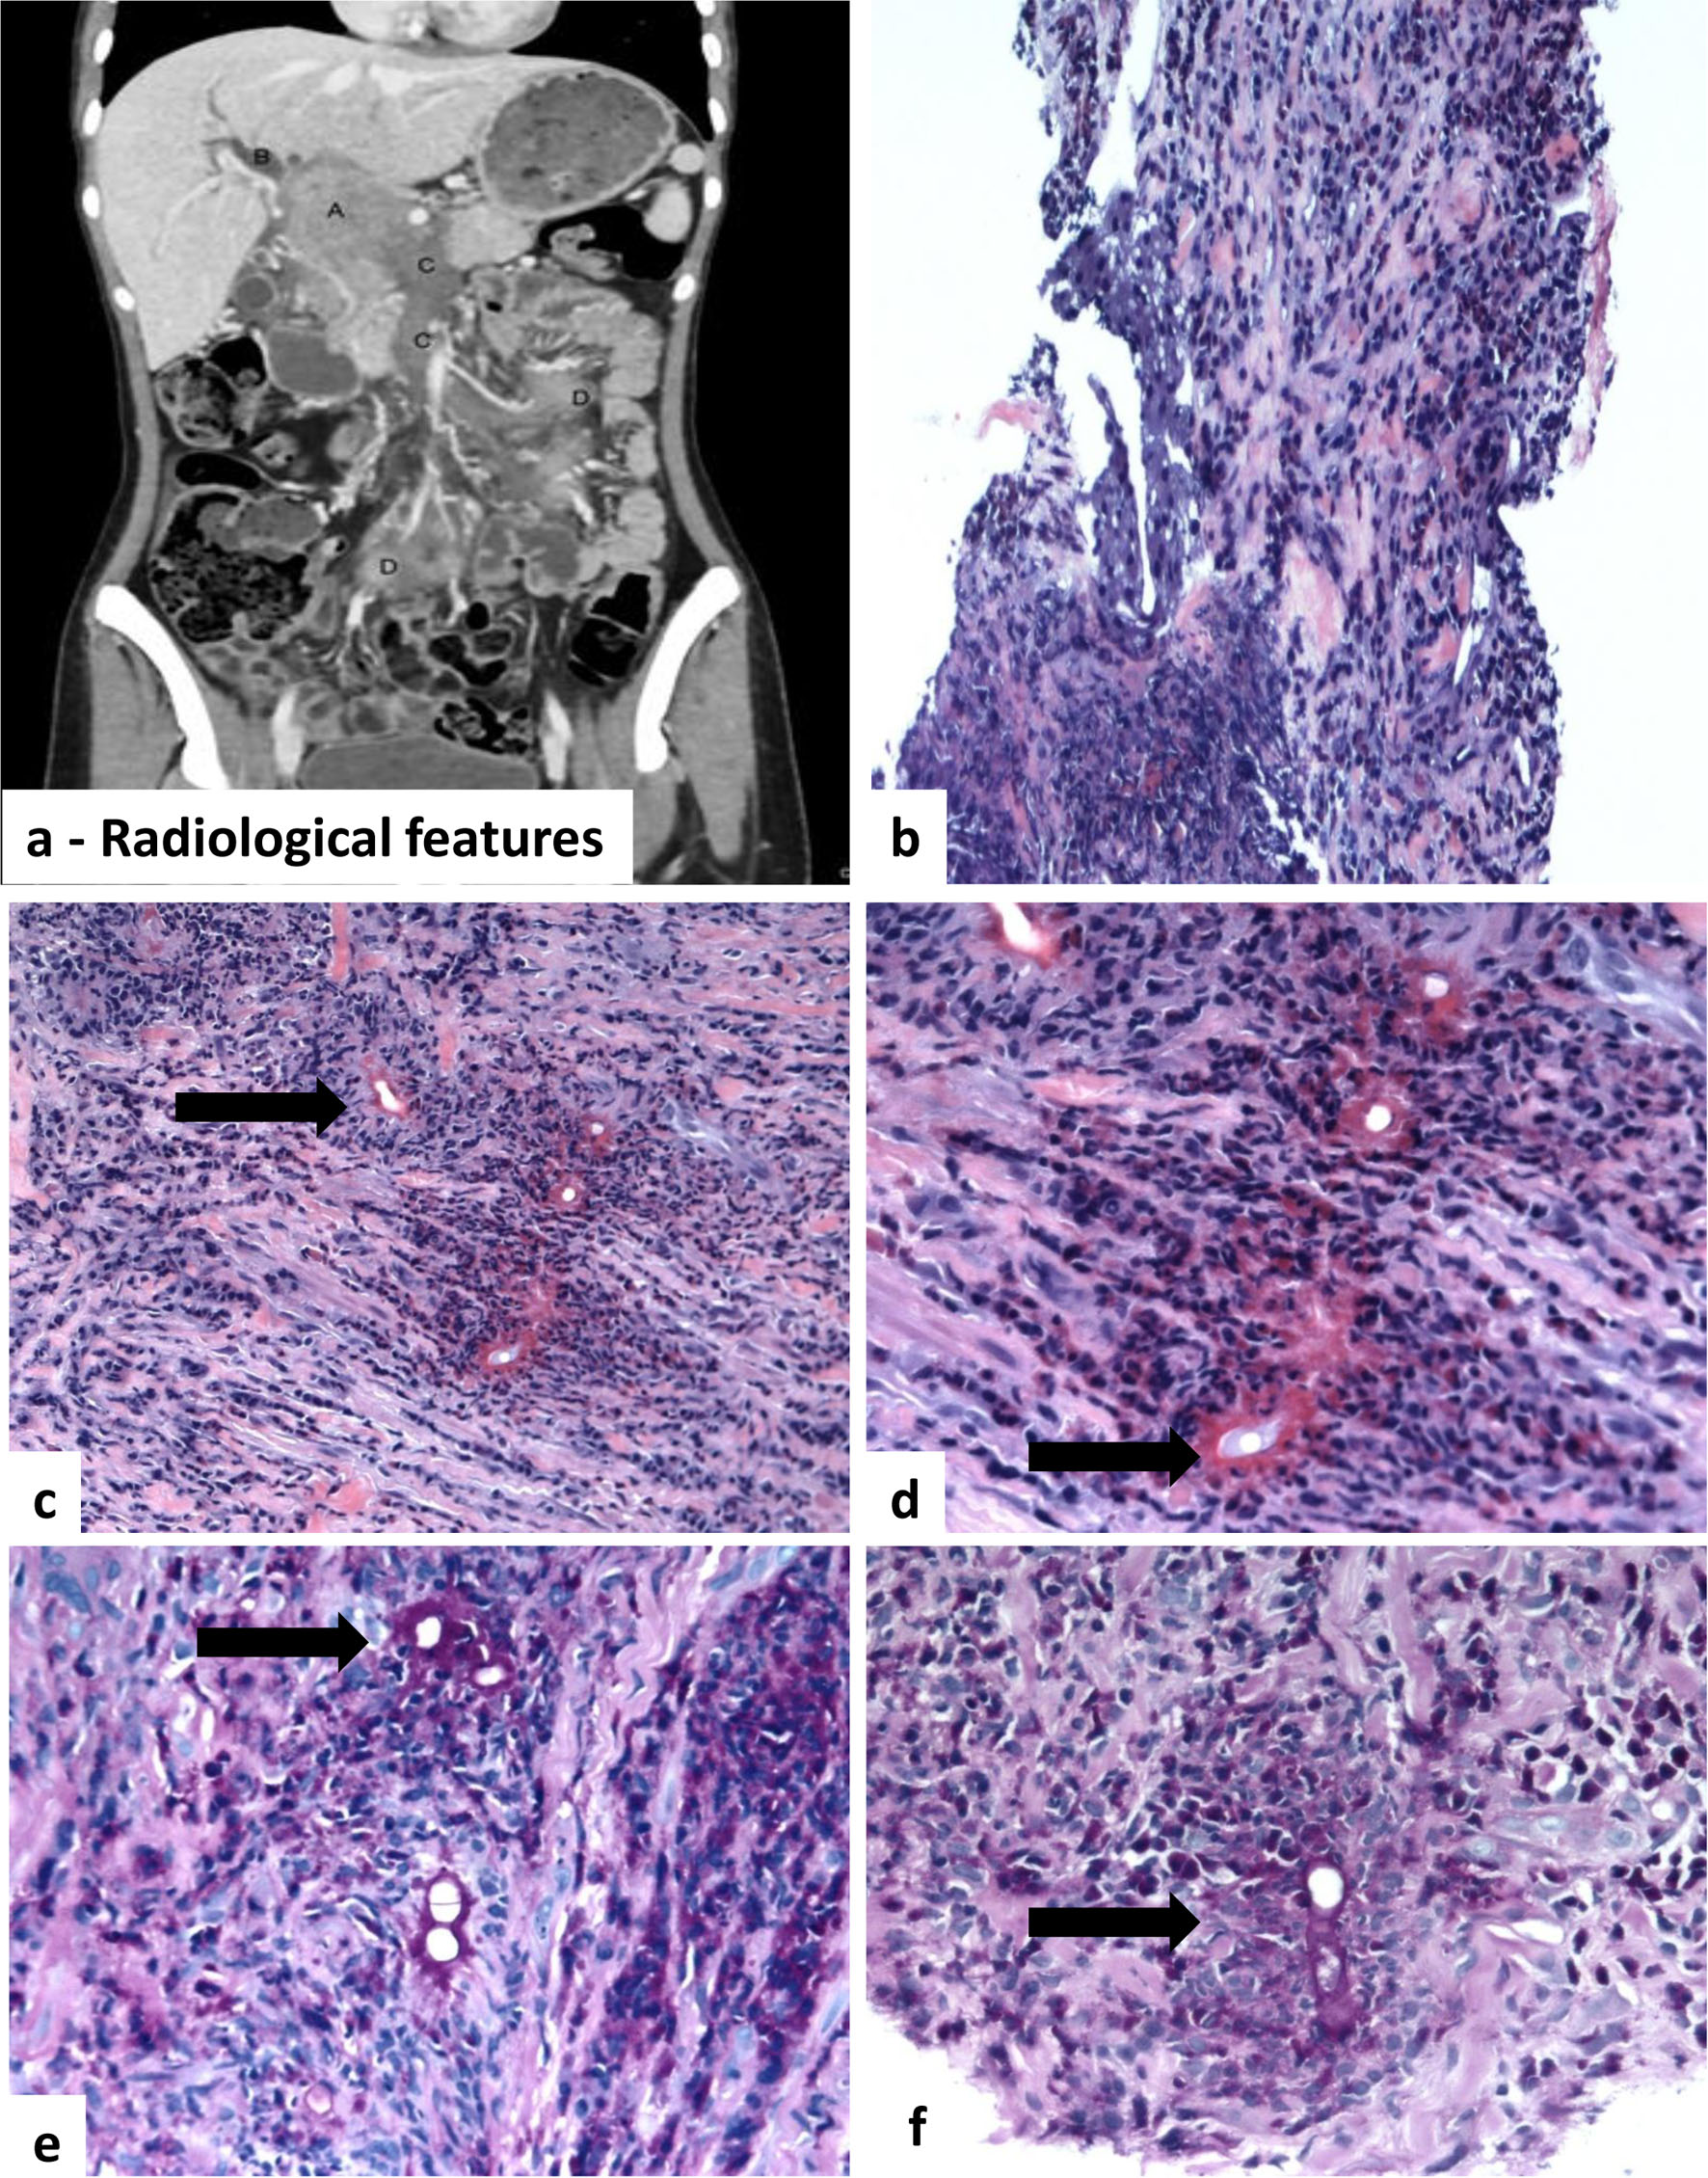
↓ Figure 2. Radiological and histological features of a basidiobolomycosis-induced inflammatory retroperitoneal fungal mass. (a) Radiological features: porta hepatis mass with biliary and vascular involvement. Contrast-enhanced CT images demonstrate a 6.5 × 4.3 cm enhancing mass in the porta hepatis (A, black arrow). The mass causes severe narrowing of the common bile duct (B, white arrowhead), resulting in marked intrahepatic biliary dilatation. There is invasion of the portal vein and superior mesenteric vein (C, white arrow). Additional metastatic deposits are seen in the small bowel mesentery (D, curved arrow). (b) Histological sections demonstrate patchy and vaguely nodular aggregates of inflammatory cells infiltrating the connective tissue. (c)–(e) Fungal hyphae surrounded by eosinophil-rich mixed inflammatory cell infiltrates. Multiple thin-walled, non-septate hyphae (thin arrow) are encased by brightly hyaline eosinophilic material (Splendore–Hoeppli phenomenon, thick arrow). Areas of necrosis are present within the fibroconnective tissue. (f) Fungal hyphae highlighted by periodic acid–Schiff (PAS) stain. Magnifications: a: × 20; b: × 100; c–e: × 400, H&E; f: × 400, PAS).
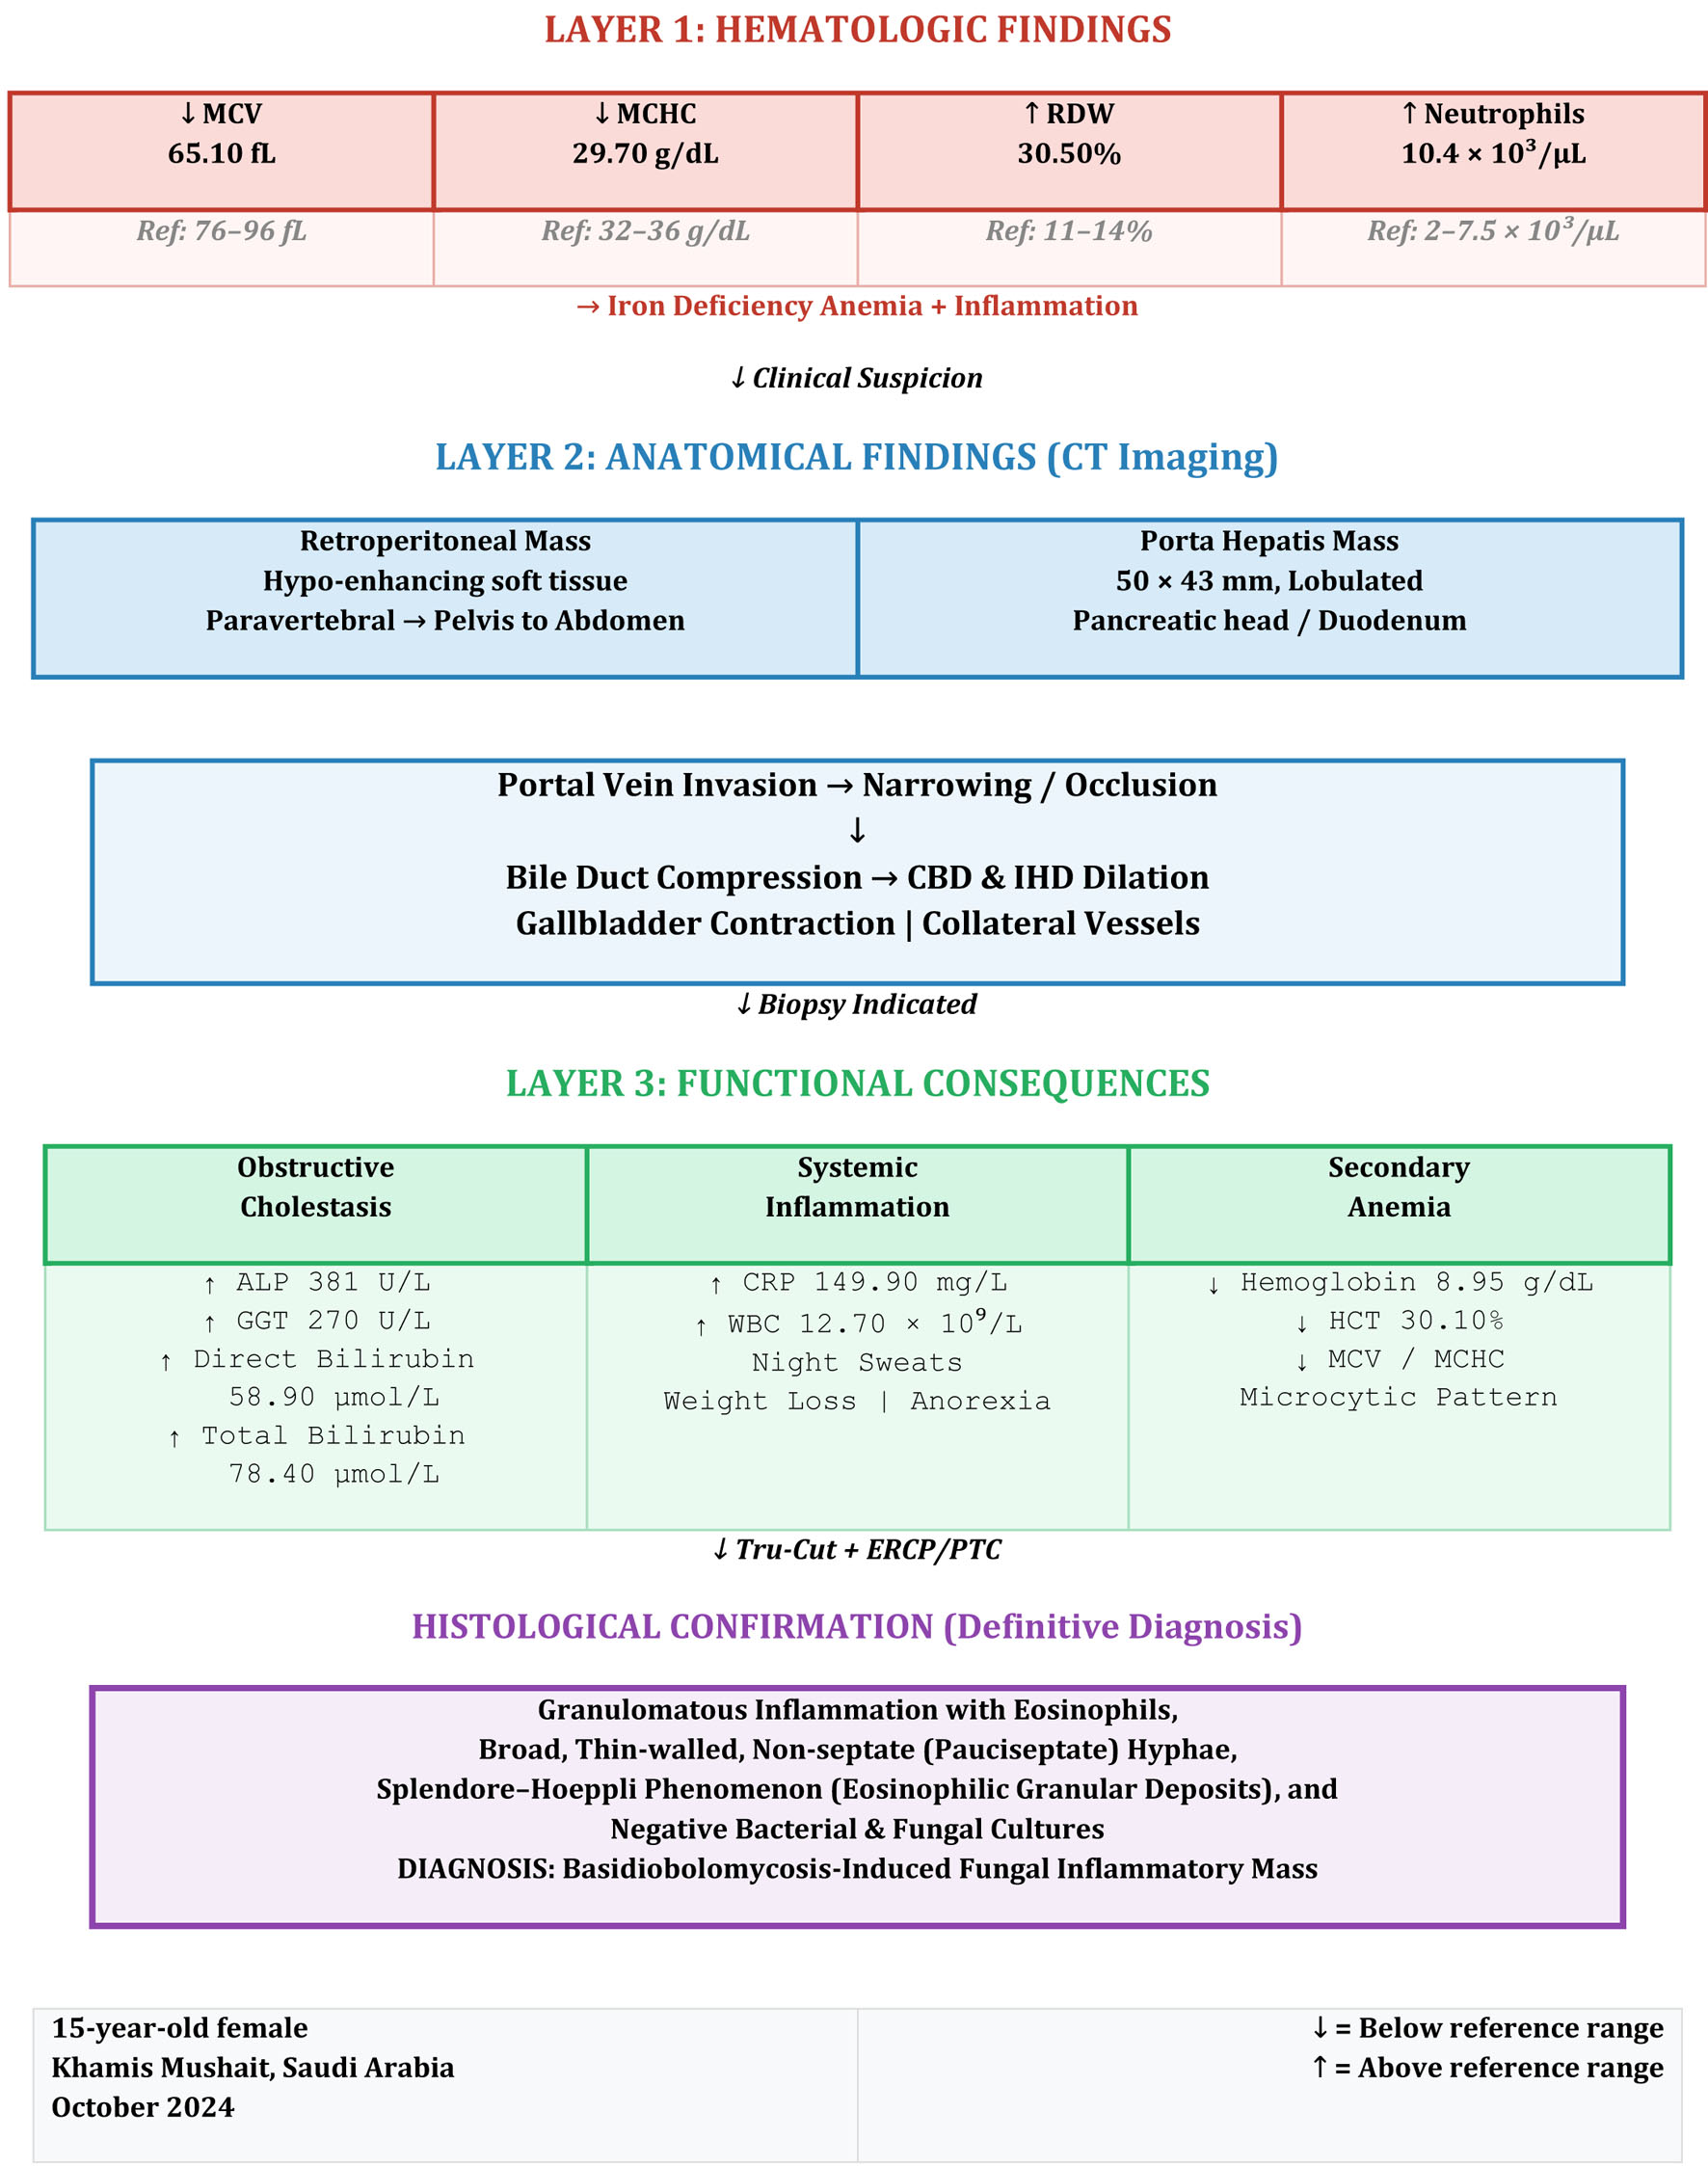
↓ Figure 3. Three-layered diagnostic framework in retroperitoneal basidiobolomycosis. Layer 1 (hematologic): iron deficiency anemia (↓MCV 65.10 fL, ↓MCHC 29.70 g/dL, ↑RDW 30.50%) with inflammation (↑neutrophils 10.4 × 10³/µL). Layer 2 (anatomical): CT revealed a retroperitoneal soft tissue mass and a 50 × 43 mm lobulated porta hepatis mass causing portal vein invasion, bile duct compression (CBD and IHD dilation), and gallbladder contraction. Layer 3 (functional): obstructive cholestasis (↑ALP 381 U/L, ↑GGT 270 U/L, ↑direct bilirubin 58.90 µmol/L), systemic inflammation (↑CRP 149.90 mg/L, ↑WBC 12.70 × 10⁹/L), and secondary anemia (↓hemoglobin 8.95 g/dL). Histological confirmation: Tru-Cut biopsy demonstrated granulomatous inflammation with eosinophils, broad pauciseptate hyphae, and Splendore–Hoeppli phenomenon, establishing the diagnosis of basidiobolomycosis despite negative cultures. ALP: alkaline phosphatase; GGT: gamma-glutamyl transferase; CBD: common bile duct; IHD: intrahepatic ducts; MCV: mean corpuscular volume; MCHC: mean corpuscular hemoglobin concentration; RDW: red cell distribution width; CRP: C-reactive protein; WBC: white blood cell count.
Table
↓ Table 1. Laboratory Findings of the Patient’s Investigations
| Description | Result | Unit | Reference range |
|---|
| Amylase - serum | 68.00 | U/L | 28–100 |
| Bone profile | | | |
| Calcium - serum | 2.19 (L) | mmol/L | 2.23–2.58 |
| Albumin modular | 35.00 | g/L | 35–48 |
| Magnesium - serum | 0.79 | mmol/L | 0.66–1.07 |
| Phosphorus - serum | 0.81 (L) | mmol/L | 1.07–2 |
| Alkaline phosphatase | 381.00 (H) | U/L | 67–372 |
| Cardiac enzymes | | | |
| Aspartate aminotransferase | 21.00 | U/L | 14–37 |
| Creatine kinase | 35.00 | U/L | 28–170 |
| Lactic dehydrogenase | 195.00 | U/L | 122–234 |
| Complete blood count with differential | | | |
| White blood cell count | 12.70 | 109/L | |
| Red blood cell count | 4.62 | 1012/L | |
| Hemoglobin | 8.95 | g/dL | |
| Hematocrit | 30.10 | % | |
| Mean corpuscular volume | 65.10 (L) | fL | 76–96 |
| Mean corpuscular hemoglobin | 19.40 | pg | |
| Mean corpuscular hemoglobin concentration | 29.70 (L) | g/dL | 32–36 |
| Red cell distribution width | 30.50 (H) | % | 11–14 |
| Platelet count | 1,010 | 109/L | |
| Mean platelet volume | 9.27 | fL | |
| Neutrophil percentage | 81.90 | % | |
| Lymphocyte percentage | 6.82 | % | |
| Monocyte percentage | 10.60 | % | |
| Eosinophil percentage | 0.04 | % | |
| Basophil percentage | 0.08 | % | |
| Immature granulocyte percentage | 0.60 | % | |
| Neutrophil absolute count | 10.4 (H) | | 2–7.5 |
| Lymphocyte absolute count | 0.86 | | |
| Monocyte absolute count | 1.34 | | |
| Eosinophil absolute count | 0 | | |
| Basophil absolute count | 0.01 | | |
| Immature granulocyte absolute count | 0.08 | | |
| Nucleated red blood cell | 0.00 | % | |
| Creatine kinase-MB | 0.50 | ng/mL | 0.46–2.04 |
| C-reactive protein | 149.90 | mg/L | < 5 |
| hs-troponin-I | < 5.1 | pg/mL | 8.4–18.3 |
| Liver function tests | | | |
| Total protein modular - serum | 87.00 (H) | g/L | 61–80 |
| Total bilirubin | 78.40 | µmol/L | < 34.2 |
| Albumin modular | 35.00 | g/L | 31–48 |
| Direct bilirubin | 58.90 (H) | µmol/L | 1.7–8.6 |
| Alanine aminotransferase | 20.00 | U/L | 8–29 |
| Aspartate aminotransferase | 21.00 | U/L | 14–37 |
| Alkaline phosphatase | 381.00 (H) | U/L | 67–372 |
| Gamma-glutamyl transpeptidase | 270.00 (H) | U/L | 8–23 |
| Renal profile | | | |
| Sodium - serum | 133.00 | mmol/L | 133–143 |
| Potassium - serum | 5.50 H | mmol/L | 3.5–5.1 |
| Chloride - serum | 103.00 | mmol/L | 98–115 |
| Creatinine - serum | 36.90 | µmol/L | 27–88 |
| Blood urea nitrogen - serum | 4.40 | mmol/L | 2.5–7.85 |