Gastroenterology Research, ISSN 1918-2805 print, 1918-2813 online, Open Access
Article copyright, the authors; Journal compilation copyright, Gastroenterol Res and Elmer Press Inc
Journal website https://gr.elmerpub.com

Original Article

Volume 19, Number 2, April 2026, pages 55-63


Burden and Impact of Pneumococcal Pneumonia on Outcomes in Patients With Cirrhosis: A Nationwide Analysis

Figure

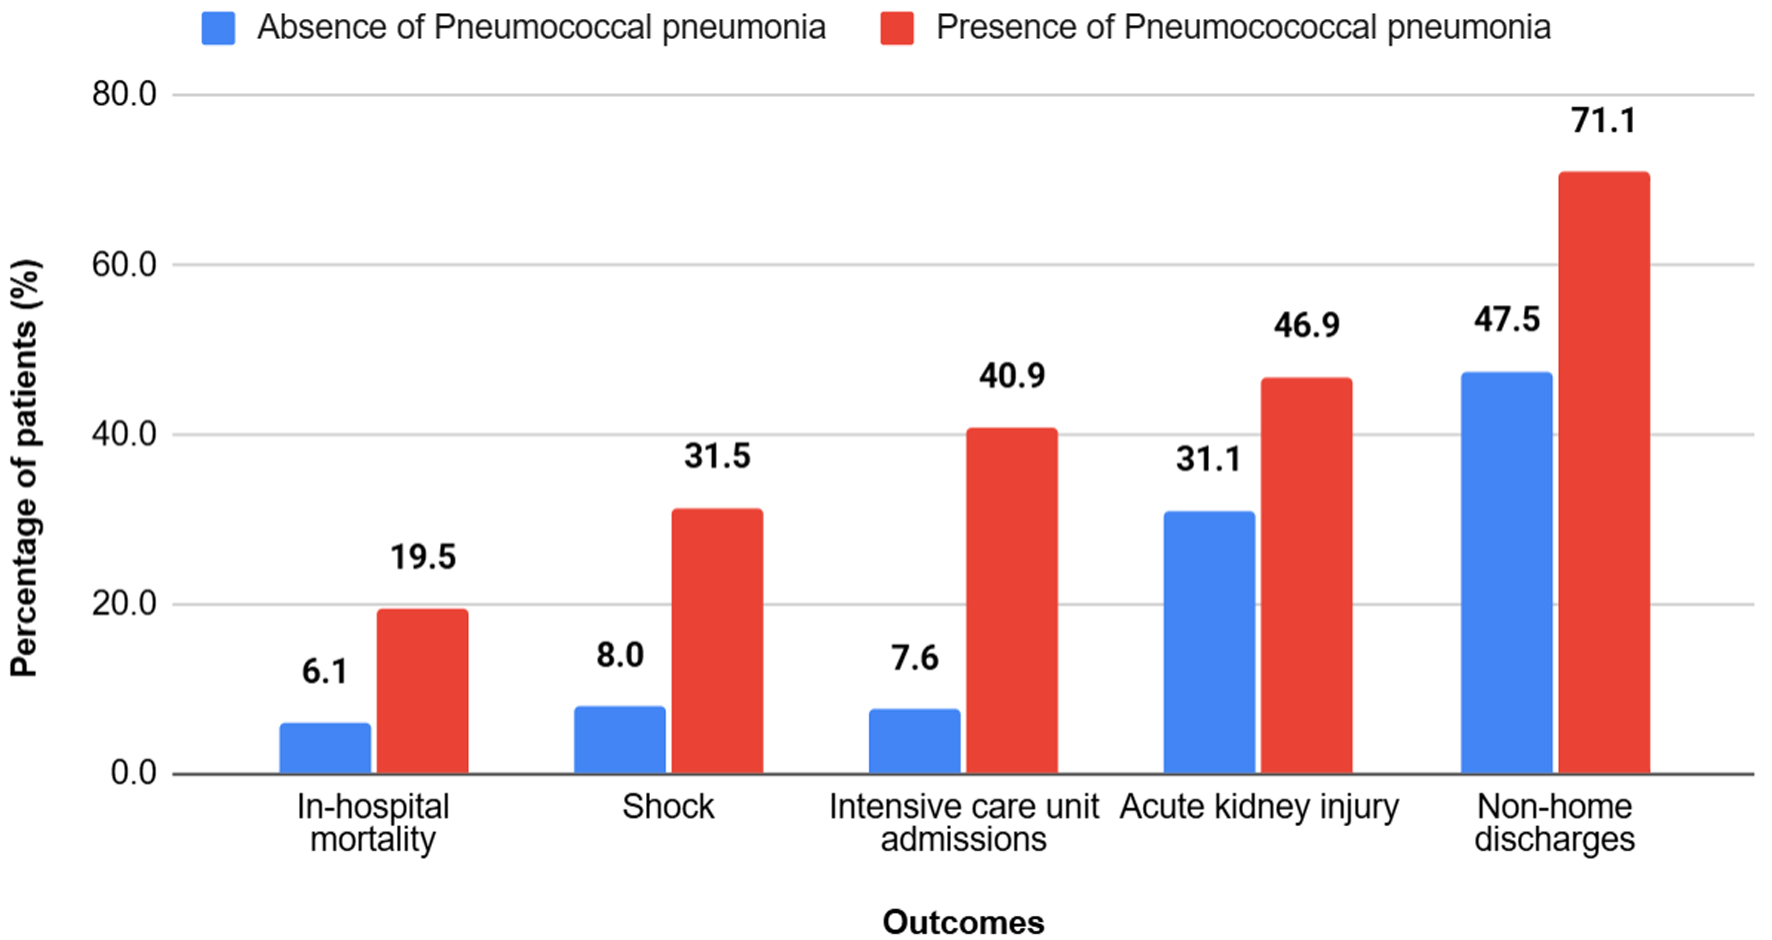
↓  Figure 1. Clinical outcomes among hospitalized patients with cirrhosis, stratified by the presence of pneumococcal pneumonia. Patients with cirrhosis and pneumococcal pneumonia experienced significantly worse clinical outcomes compared with those without pneumococcal pneumonia, including higher rates of in-hospital mortality, shock, intensive care unit admission, acute kidney injury, and non-home discharge (P < 0.001 for all outcomes).
Figure 1.

Tables

↓  Table 1. Patient and Hospital Characteristics Among Hospitalized Patients With Cirrhosis, Stratified by the Presence of Pneumococcal Pneumonia
 
Patient and hospital characteristicsAbsence of pneumococcal pneumonia, n (%)Presence of pneumococcal pneumonia, n (%)P-value
n (%): number of patients in each group (percentage of patients).
Age category< 0.001
  18–44536,750 (11.6)9,235 (10.2)
  45–642,348,644 (50.8)45,215 (49.9)
  > 651,740,789 (37.6)36,230 (39.9)
Sex< 0.001
  Males2,767,419 (59.8)56,300 (62.1)
  Females1,858,764 (40.2)34,380 (37.9)
Race< 0.001
  White3,059,494 (66.1)61,955 (68.3)
  Black482,105 (10.4)9,060 (9.9)
  Hispanic784,890 (17.0)12,930 (14.3)
  Asian/Pacific Islander96,610 (2.1)1,855 (2.0)
  Native American75,325 (1.6)2,065 (2.3)
  Other127,760 (2.8)2,815 (3.1)
Primary expected payer< 0.001
  Medicare2,190,794 (47.4)45,415 (50.1)
  Medicaid1,169,564 (25.3)23,740 (26.2)
  Private856,705 (18.5)14,540 (16.0)
  Uninsured251,155 (5.4)3,900 (4.3)
Median household income< 0.001
  Lowest quartile1,578,189 (34.1)33,485 (36.9)
  Second quartile1,231,645 (26.6)24,895 (27.5)
  Third quartile1,061,520 (23.0)19,655 (21.7)
  Highest quartile754,830 (16.3)12,645 (13.9)
Region of hospital< 0.001
  Northeast791,304 (17.1)14,015 (15.5)
  Midwest904,525 (19.6)20,330 (22.4)
  South1,872,060 (40.5)36,945 (40.7)
  West1,058,294 (22.9)19,390 (21.4)
Teaching status of the hospitals0.01
  Non-teaching hospitals1,214,614 (26.3)24,755 (27.3)
  Teaching hospitals3,411,569 (73.7)65,925 (72.7)
Bed size of hospital< 0.001
  Small910,688 (19.7)16,415 (18.1)
  Medium1,329,269 (28.7)25,655 (28.3)
  Large2,386,226 (51.6)48,610 (53.6)


↓  Table 2. Underlying Liver Disease and Liver-Related Decompensations Among Patients With Cirrhosis, Stratified by the Presence of Pneumococcal Pneumonia
 
Absence of pneumococcal pneumonia, n (%)Presence of pneumococcal pneumonia, n (%)P-value
n (%): number of patients in each group (percentage of patients).
Underlying liver disease
  Alcohol-associated liver disease2,112,164 (45.7)38,800 (42.8)< 0.001
  Hepatitis C831,415 (18.0)17,155 (18.9)< 0.001
  Hepatitis B93,950 (2.0)2,065 (2.3)0.02
  Metabolic dysfunction- associated steatohepatitis605,930 (13.1)8,920 (9.8)< 0.001
  Autoimmune liver disease52,645 (1.1)815 (0.9)0.003
  Cholestatic liver disease48,750 (1.1)735 (0.8)0.001
  Hepatocellular carcinoma186,835 (4.0)2,400 (2.6)< 0.001
Decompensations
  Hepatic encephalopathy454,930 (9.8)22,510 (24.8)< 0.001
  Ascites1,923,684 (41.6)33,925 (37.4)< 0.001
  Hepatorenal syndrome230,100 (5.0)5,990 (6.6)< 0.001
  Variceal bleeding259,035 (5.6)3,710 (4.1)< 0.001


↓  Table 3. Comorbidities Among Patients With Cirrhosis, Stratified by the Presence of Pneumococcal Pneumonia
 
ComorbiditiesAbsence of pneumococcal pneumonia, n (%)Presence of pneumococcal pneumonia, n (%)P-value
n (%): number of patients in each group (percentage of patients).
Renal failure1,234,195 (26.7)25,270 (27.9)< 0.001
Heart failure1,121,440 (24.2)31,185 (34.4)< 0.001
Coronary artery disease779,060 (16.8)15,175 (16.7)0.71
Chronic obstructive pulmonary disease898,120 (19.4)33,175 (36.6)< 0.001
Alcohol use2,354,424 (50.9)43,575 (48.1)< 0.001
Obesity785,375 (17.0)15,275 (16.8)0.65
Smoking2,159,469 (46.7)38,890 (42.9)< 0.001
Hyperlipidemia1,203,495 (26.0)21,145 (23.3)< 0.001
Hypertension1,466,824 (31.7)22,635 (25.0)< 0.001
Diabetes1,641,819 (35.5)37,870 (41.8)< 0.001
Modified Charlson Comorbidity Index< 0.001
  0524,780 (11.3)6,580 (7.3)
  1479,650 (10.4)10,615 (11.7)
  21,033,230 (22.3)18,430 (20.3)
  3 or more2,588,524 (56.0)55,055 (60.7)


↓  Table 4. Clinical Outcomes and Resource Utilization Among Patients With Cirrhosis, Stratified by the Presence of Pneumococcal Pneumonia
 
Absence of pneumococcal pneumoniaPresence of pneumococcal pneumoniaP-value
n (%): number of patients in each group (percentage of patients).
Outcomes, n (%)
  In-hospital mortality280,485 (6.1)17,655 (19.5)< 0.001
  Shock367,780 (8.0)28,565 (31.5)< 0.001
  Intensive care unit admissions351,715 (7.6)37,105 (40.9)< 0.001
  Acute kidney injury1,438,505 (31.1)42,530 (46.9)< 0.001
  Non-home discharges2,195,894 (47.5)64,435 (71.1)< 0.001
Resource utilization, mean ± SD
  Mean length of stay (days)6.14 ± 0.0113.46 ± 0.12< 0.001
  Mean total hospitalization charges ($)73,853.08 ± 503.28195,248.1 ± 3,097.77< 0.001


↓  Table 5. Multivariate Logistic Regression Model Examining the Relationship Between Pneumococcal Pneumonia and Clinical Outcomes Among Patients With Cirrhosis
 
OutcomesAdjusted odds ratio95% Confidence intervalP-value
In-hospital mortality2.952.84–3.09< 0.001
Shock4.754.58–4.93< 0.001
Intensive care unit admissions7.557.28–7.83< 0.001
Acute kidney injury1.851.79–1.91< 0.001
Non-home discharges2.292.21–2.38< 0.001
Resource utilizationAdjusted odds coefficient95% Confidence intervalP-value
Length of stay6.616.38–6.83< 0.001
Total hospitalization charges112,230.50106,802.3–117,658.7< 0.001