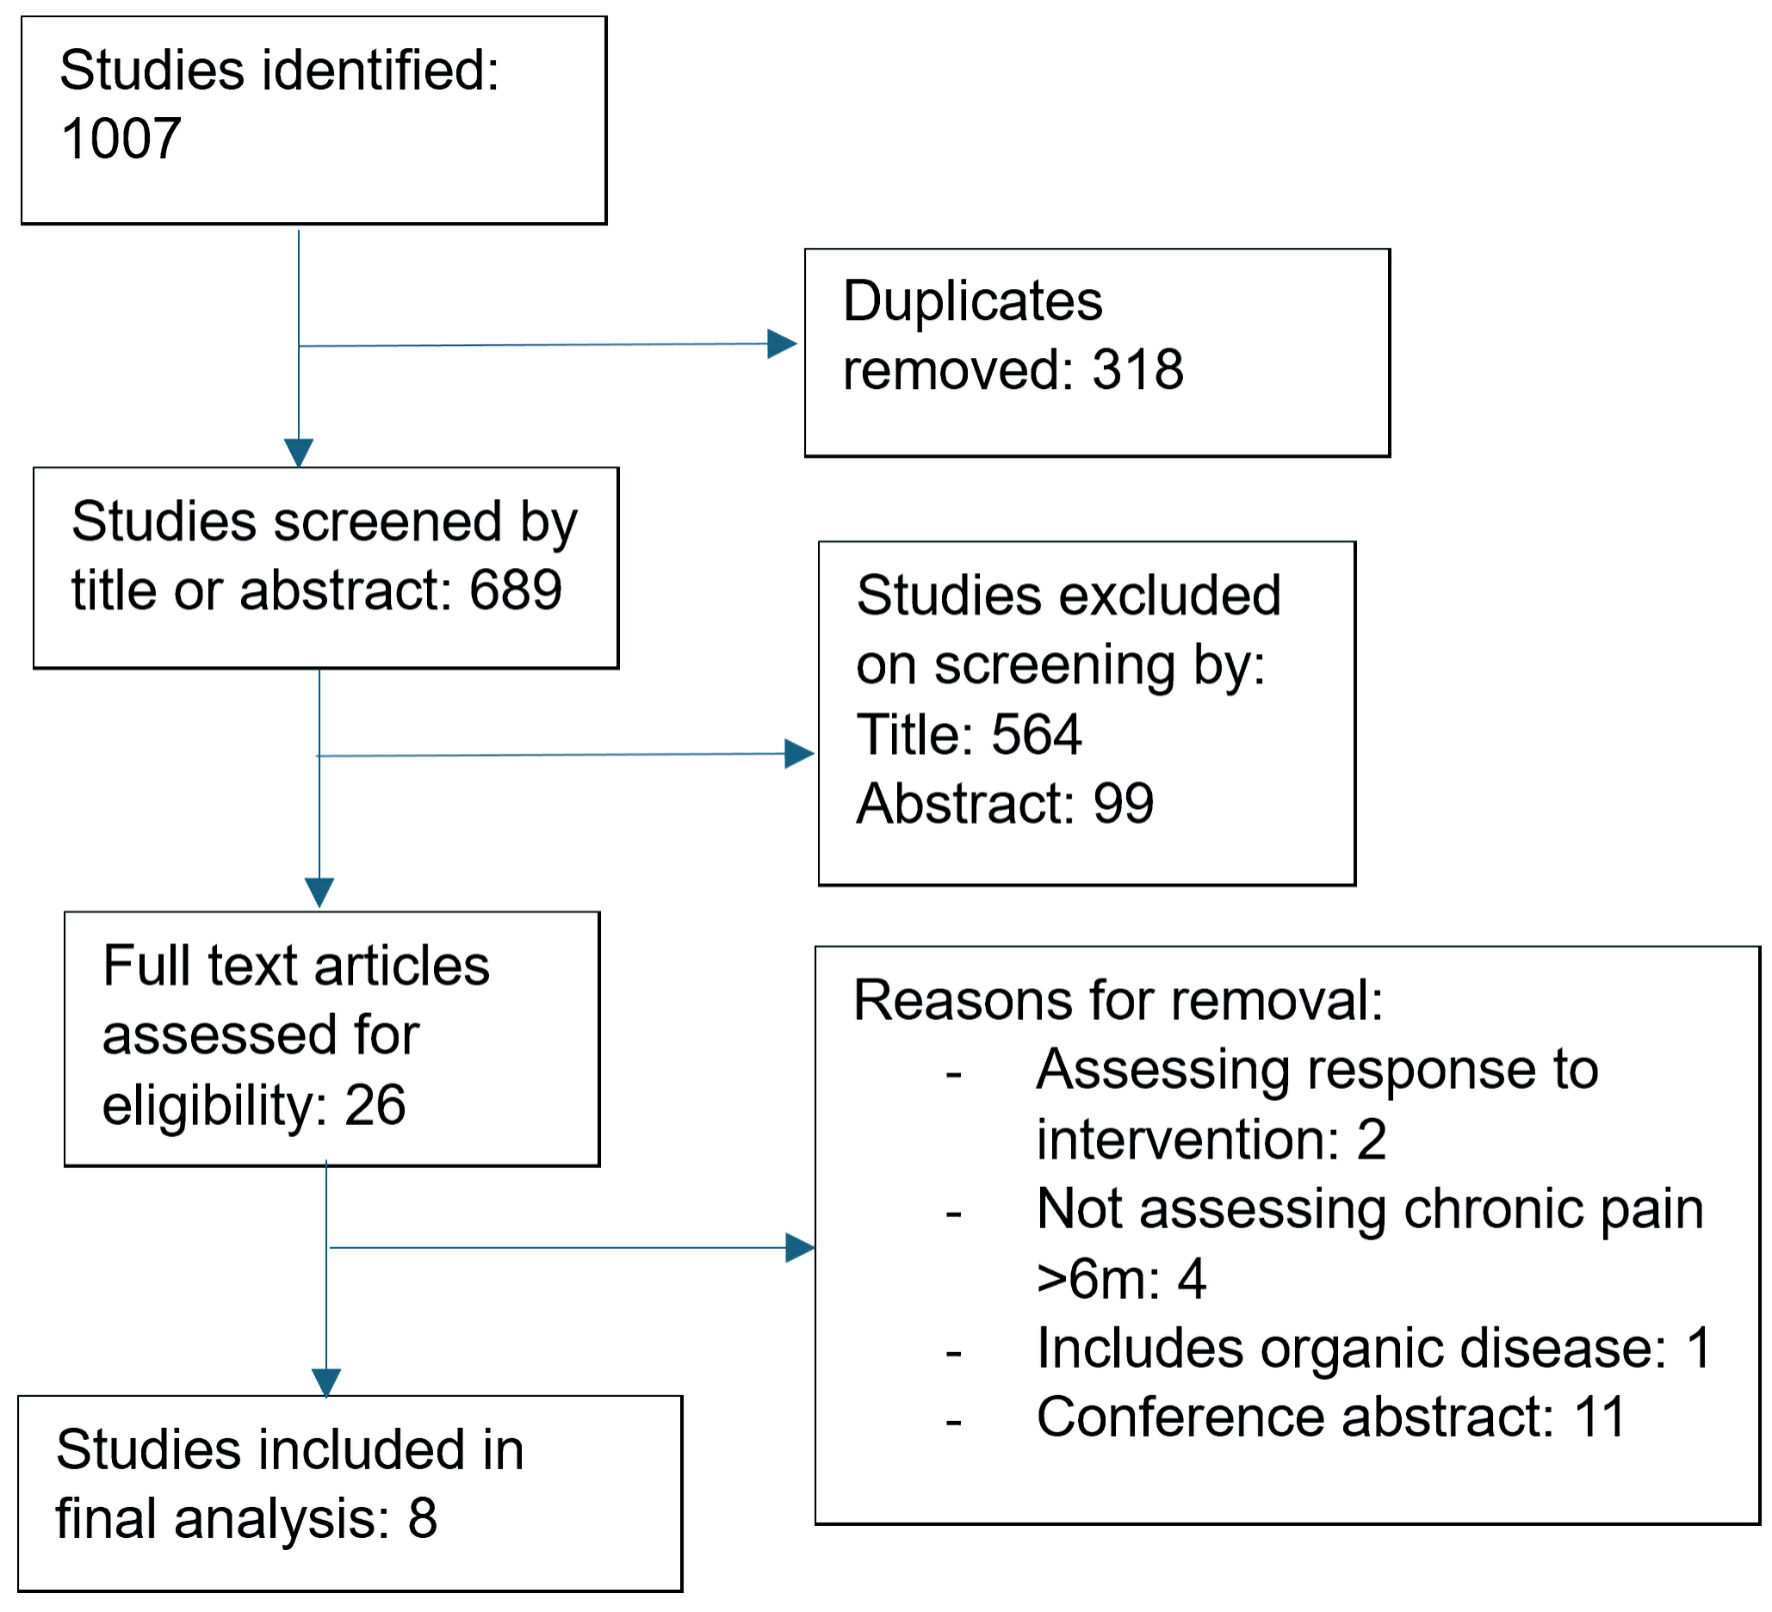
↓ Figure 1. PRISMA flowchart. PRISMA: Preferred Reporting Items for Systematic Reviews and Meta-Analyses.
| Gastroenterology Research, ISSN 1918-2805 print, 1918-2813 online, Open Access |
| Article copyright, the authors; Journal compilation copyright, Gastroenterol Res and Elmer Press Inc |
| Journal website https://gr.elmerpub.com |
Review
Volume 19, Number 4, August 2026, pages 175-183
Identifying Prognostic Factors Implicated in Chronic Functional Abdominal Pain in Children: A Systematic Review
Figure
Tables
| Authors, year | Aim of study | Type of study | Number of patients | Target population | Outcome measure | Summary of results | Limitations |
|---|---|---|---|---|---|---|---|
| RAP: recurrent abdominal pain; FAP: functional abdominal pain; IBS: irritable bowel syndrome; FGID: functional gastrointestinal disorder; FD: functional dyspepsia; GI: gastrointestinal. | |||||||
| Sjolund et al, 2021 [21] | To assess the natural history of recurrent childhood abdominal pain from early childhood through adolescence | Prospective population-based birth cohort study | 2,455, from original cohort of 4,089 | Children born 1994–1996 in Stockholm, Sweden, followed from infancy to 16 years | RAP, AP-FGID and IBS at 16 years by parental/child questionnaires scored against Rome III criteria | Recurrent abdominal pain age 12 years is predictive of RAP/FGID at age 16 years | Recurrent abdominal pain at age 1–2 years defined as parent-reported colic. Outcome largely based on questionnaire/self-report; around 60% cohort retention with potential selection bias. |
| Cunningham et al, 2017 [23] | To identify link between pain intensity, pain-related disability and anxiety with pain-related disability at 6 months | Prospective cohort study | 99 at baseline, 64 at follow-up | Pediatric FGID patients (ages 8–18, Rome III, gastroenterologist-diagnosed) at a large Midwestern children’s hospital, USA | Functional Disability Inventory-Child version (FDI-C, self-report) at 6 months | Patients categorized by number of risk factors (0–3). The presence of 2+ risk factors predicted pain-related disability at 6 months | Little differentiation between FAP/IBS/FD. Short duration follow-up. Small number of participants with 35% lost to follow-up |
| Russell et al, 2017 [22] | To identify the link between nausea and long-term morbidity in pediatric patients with FAP | Prospective cohort study | 871 at baseline, 392 at followed-up | Pediatric FAP patients (8–17 years) seen in a pediatric GI clinic, USA | GI, non-GI symptoms, depression, functional disability > 4 years later | Nausea is associated with higher risk of depression, anxiety, GI and somatic symptoms 4 years later | No assessment of outcomes at start of assessment (e.g., correlation of nausea with current anxiety/non-somatic symptoms). Approx 52% follow-up; age difference between groups wer not adjusted for. |
| Czyzewski et al, 2016 [28] | To assess whether anxiety or pain–stooling relations predict long-term maintenance of abdominal pain | Prospective cohort study | 76 | Children aged 7–10 years with FAP recruited from primary and tertiary care, USA | Parent-reported abdominal pain frequency 18–24 months later | Anxiety not predictive of persistence of pain. IBS symptoms are predictive | Overlap between IBS and FAP in intervention group. Small sample. No adjustment for confounders. |
| Horst et al, 2014 [25] | Relation between GI symptoms, extra-intestinal somatic symptoms and depressive symptoms on likelihood of FGID at follow-up | Prospective cohort study | 760 at baseline, 392 at followed-up | 8–16Y with recurrent chronic abdominal pain (Apley criteria), at a single tertiary pediatric GI clinic, USA | ROME III FGID (IBS, FD, FAPS, abdominal migraine) > 3 years later | 41% met ROME III criteria at follow-up, mostly IBS. Extraintestinal somatic and depressive symptoms were predictive. Severity of abdominal pain, age and gender were not. | ROME III used for follow-up but not for initial diagnosis. Some of GI symptoms at exposure may indicate a diagnosis of IBS/FD. Tertiary care sample may limit generalizability, interim treatment was not captured. |
| Walker et al, 2012 [26] | Identify childhood FAP profiles and test whether they predict FGID, psychiatric disorder and central sensitization in later life | Prospective cohort study | Baseline 843, 760 eligible for follow-up. 379 followed-up, 211 for lab subset | Consecutive new pediatric FAP patients at tertiary pediatric clinic, USA, average age 12 years | ROME III FGID and chronic pain (PPQ), DSM IV anxiety/depressive disorder | Three profiles identified. Association between high pain dysfunctional type and FGID at follow-up | Approx 50% attrition; no baseline psychiatric/chronic-pain assessment; tertiary-care sample may limit generalizability. |
| Bonilla et al, 2011 [24] | Investigate whether obesity predicts persistence of pain and disability at long-term follow-up of FGIDs | Prospective cohort study | Identified 301, 188 enrolled and followed-up | Children, mean age 13.3 years, with ROME II FAP/IBS/FD, single pediatric GI division, USA | Persistence of pain, pain intensity/frequency and school absenteeism at follow-up 12–15 months later | 61.7% had persistent pain at follow-up. Obesity is associated with poor long-term outcome and disability | Included IBS/FAP/FD (not much differentiation). Diet was not controlled. Unadjusted for age, gender, baseline severity. No range for age given; however, all participants were recruited from pediatric clinic. |
| Helgeland et al, 2011 [27] | Whether pediatric FAP outpatients have more somatic/mental-health symptoms than a population sample, and whether child and maternal symptoms predict persistent abdominal pain and disability at follow-up | Prospective cohort study | Baseline 94, follow-up 88 | 8–15 years old, with FAP; four general pediatric outpatient clinics, Norway | Self-reported abdominal pain index and functional disability inventory at 6–9 months | Patients had far more somatic and emotional symptoms than school children. Older age at baseline and peer problems were associated with persistent abdominal pain. Older age, emotional symptoms, prosocial behavior and maternal somatic symptoms predicted disability. | Short follow-up, self-reported outcomes. Child emotional symptoms only by mother/teacher. |
| Study | Selectiona | Comparability | Outcome | Quality assessmentb |
|---|---|---|---|---|
| aAssessment using Newcastle-Ottawa Quality assessment scale. bConversion to AHRQ standards (good quality: three or four stars in selection domain, and one or two stars in comparability domain, and two or three stars in outcome/exposure domain; fair quality: two stars in selection domain, and one or two stars in comparability domain, and two or three stars in outcome/exposure domain; poor quality: zero or one star in selection domain, or zero stars in comparability domain, or zero or one star in outcome/exposure domain) | ||||
| Sjolund et al, 2021 [21] | ✰✰✰ | ✰✰ | ✰✰ | Good |
| Cunningham et al, 2017 [23] | ✰✰✰ | ✰ | ✰ | Poor |
| Russell et al, 2017 [22] | ✰✰ | ✰ | ✰✰ | Fair |
| Czyzewski et al, 2016 [28] | ✰✰ | ✰ | Poor | |
| Horst et al, 2014 [25] | ✰✰ | ✰✰ | ✰✰✰ | Fair |
| Walker et al, 2012 [26] | ✰✰ | ✰✰ | ✰✰✰ | Fair |
| Bonilla et al, 2011 [24] | ✰✰✰ | ✰✰ | Poor | |
| Helgeland et al, 2011 [27] | ✰✰ | ✰✰ | ✰✰ | Fair |