Gastroenterology Research, ISSN 1918-2805 print, 1918-2813 online, Open Access
Article copyright, the authors; Journal compilation copyright, Gastroenterol Res and Elmer Press Inc
Journal website https://gr.elmerpub.com

Original Article

Volume 19, Number 4, August 2026, pages 204-216


Nonlinear Associations of Estimated Pulse Wave Velocity With Hepatic Steatosis and Liver Stiffness in Community-Based People

Figures

↓  Figure 1. Study flowchart. The flowchart showed that the final analysis comprised 1,116 participants, among whom 613 patients had no MAFLD, 232 had light MAFLD, 202 had moderate MAFLD, 69 had severe MAFLD; 886 had no liver fibrosis, 172 had light liver fibrosis, 52 had moderate liver fibrosis, and six had severe liver fibrosis. MAFLD: metabolic dysfunction–associated fatty liver disease.
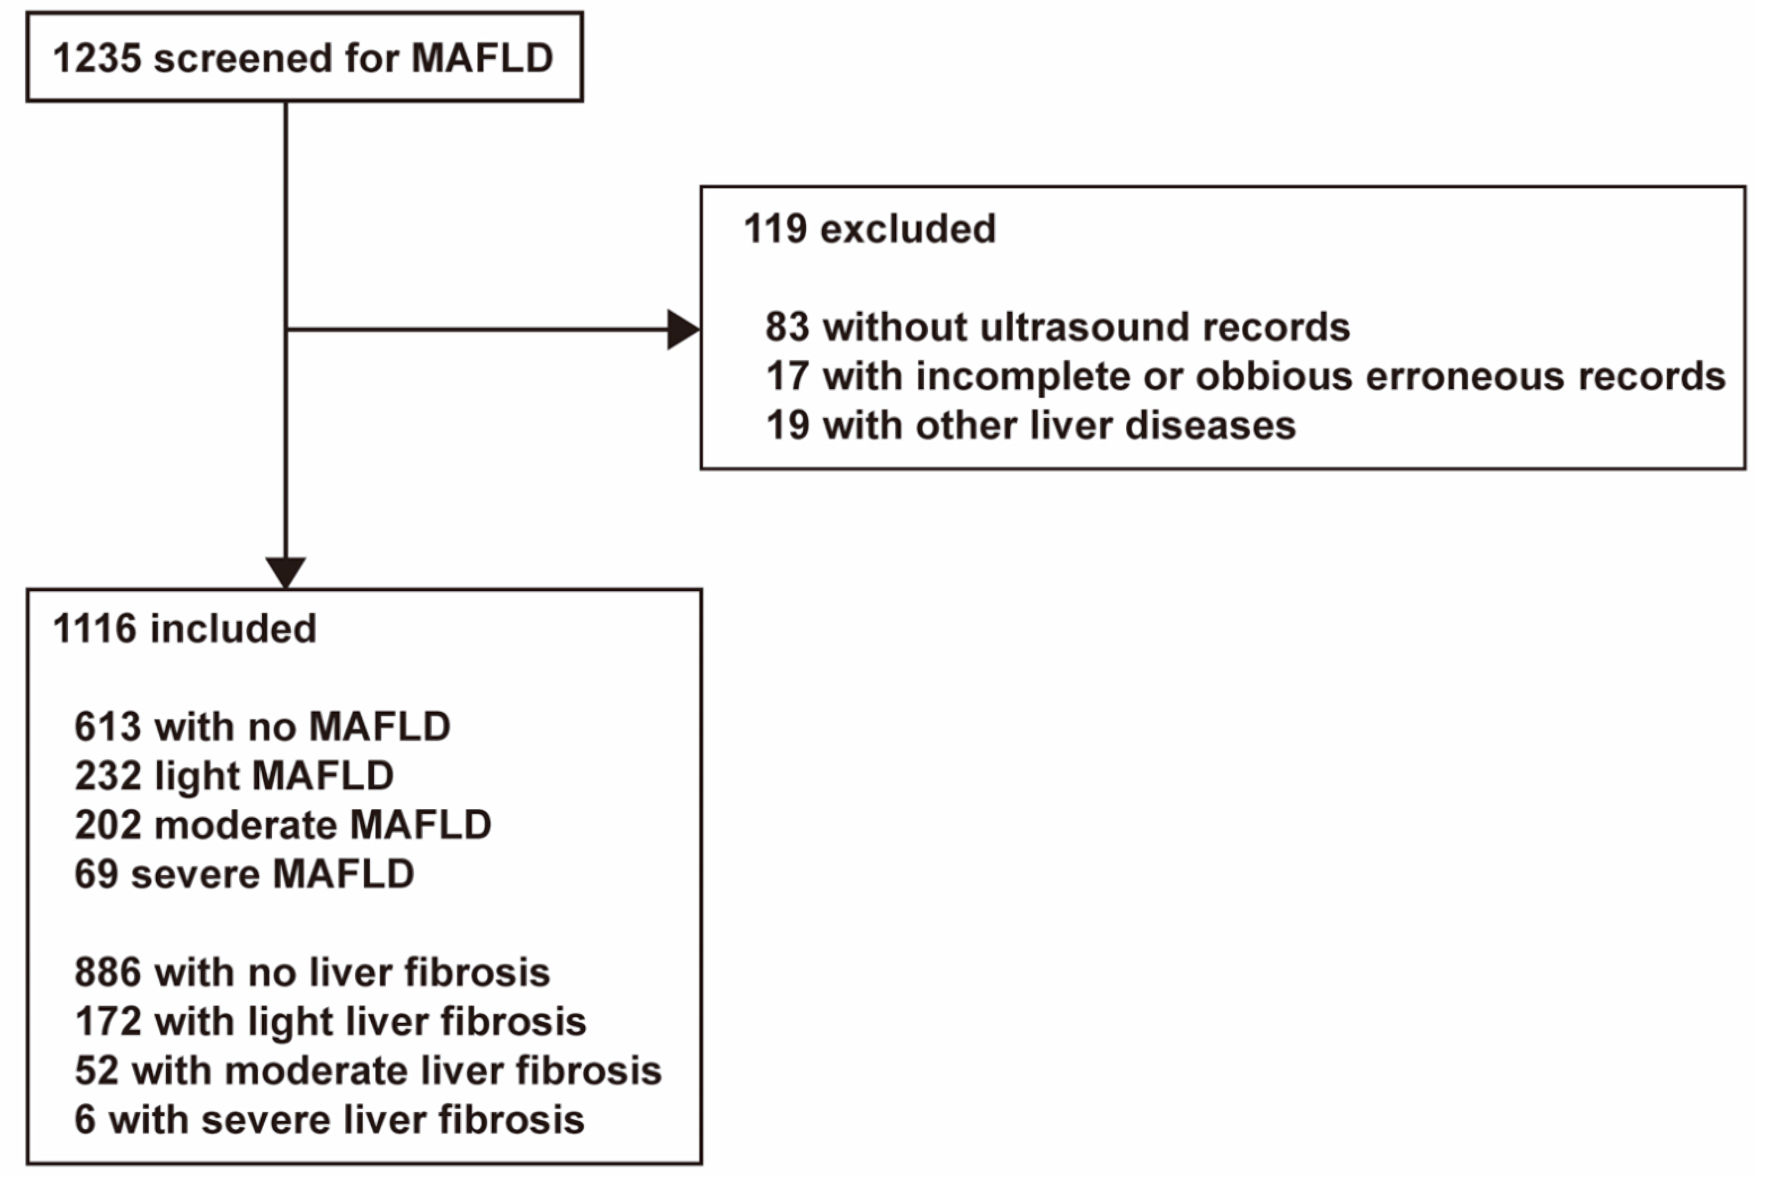
Figure 1.
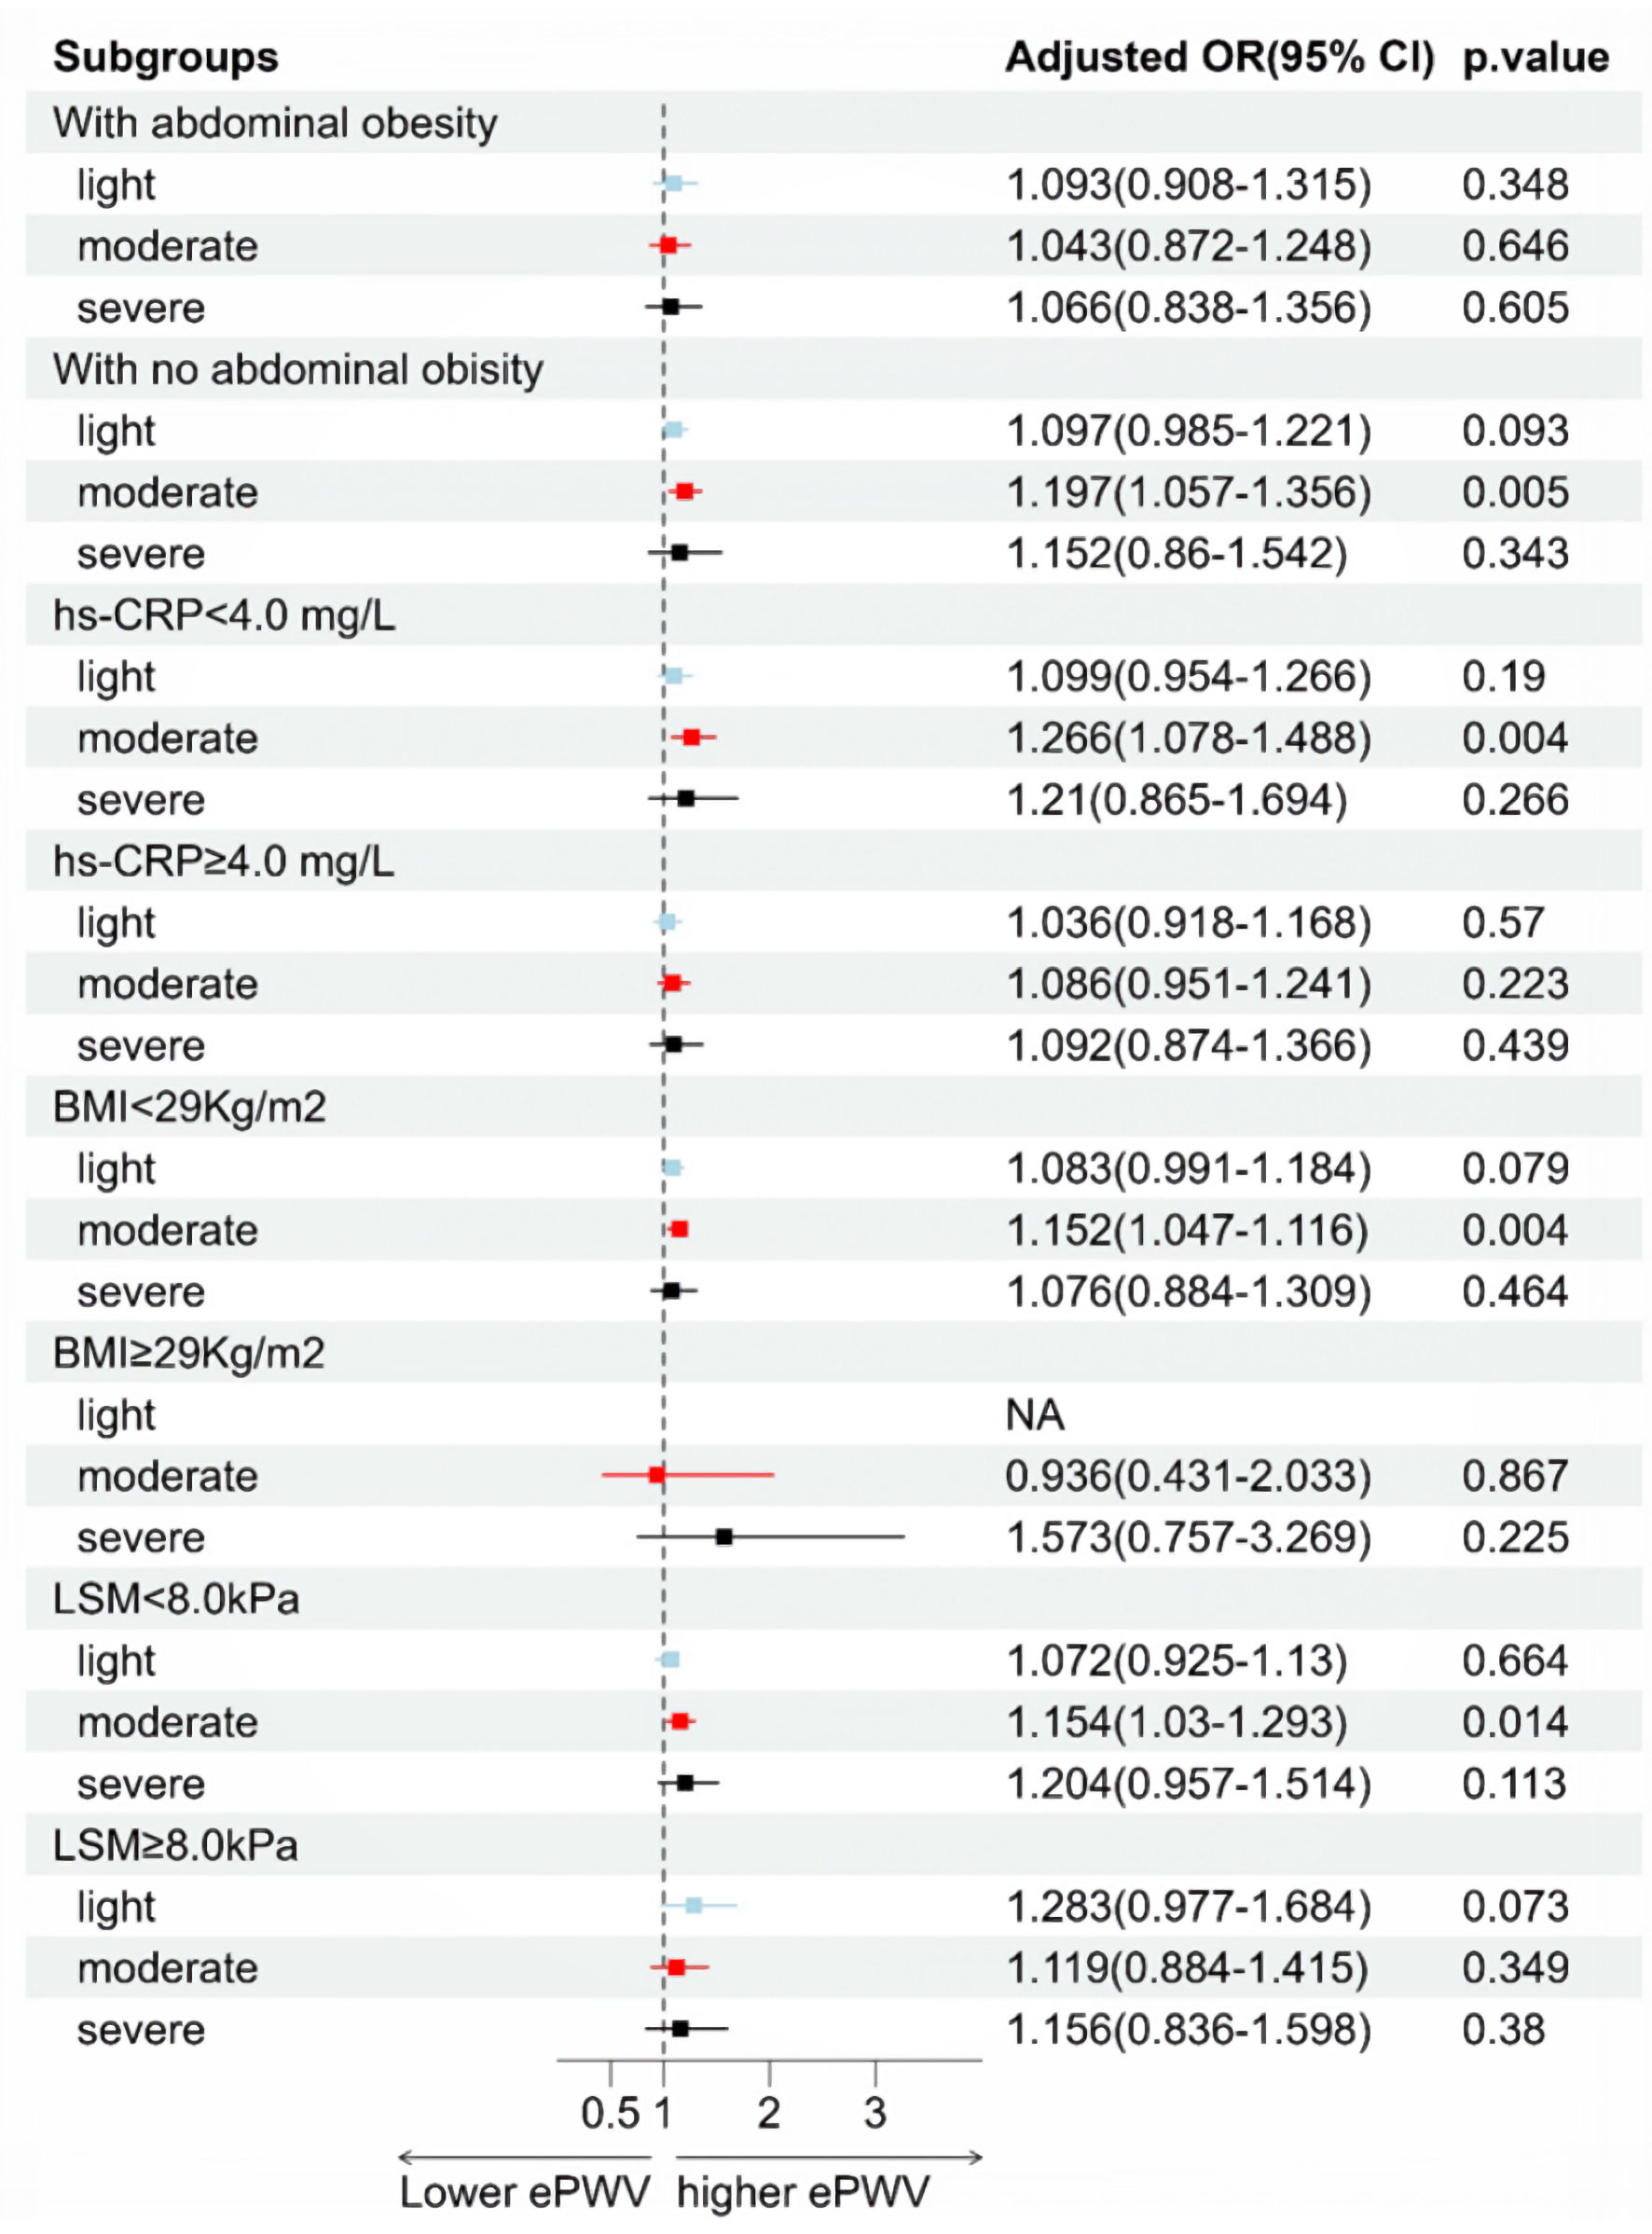
↓  Figure 2. Association of ePWV and MAFLD in different subgroups. The forest plot displays the adjusted odds ratios (ORs) and 95% confidence intervals (CIs) for the association between ePWV and MAFLD severity (light, moderate, and severe) across various clinical subgroups, adjusted for age, BMI, waist circumference, hip circumference, current smoker, sedentary time, dyslipidemia, hypertension, COPD, diabetes, DM/IGR, LSM, TC, TG, ALT, AST and hs-CRP. The vertical dashed line represents the unity line (OR = 1.0). Colored squares indicate point estimates: blue for light, red for moderate, and black for severe MAFLD. Horizontal lines represent the 95% CIs. P < 0.05 is considered statistically significant. Statistical significance (P < 0.05) is achieved when the 95% CI does not cross the unity line. Moderate MAFLD (red) demonstrated significant associations with higher ePWV in several strata (P < 0.05), while light (blue) and severe (black) groups generally showed similar positive trends without reaching statistical significance. MAFLD: metabolic dysfunction–associated fatty liver disease; ePWV: estimated pulse wave velocity; OR: odds ratio; CI: confidence interval; BMI: body mass index; LSM: liver stiffness measurement; COPD: chronic obstructive pulmonary disease; DM: diabetes mellitus; IGR: impaired glucose regulation; TC: total cholesterol; TG: triacylglycerols; ALT: alanine aminotransferase; AST: aspartate aminotransferase; hs-CRP: hypersensitive C-reactive protein (4.0 mg/L was the mean value of hs-CRP in all subjects).
Figure 2.
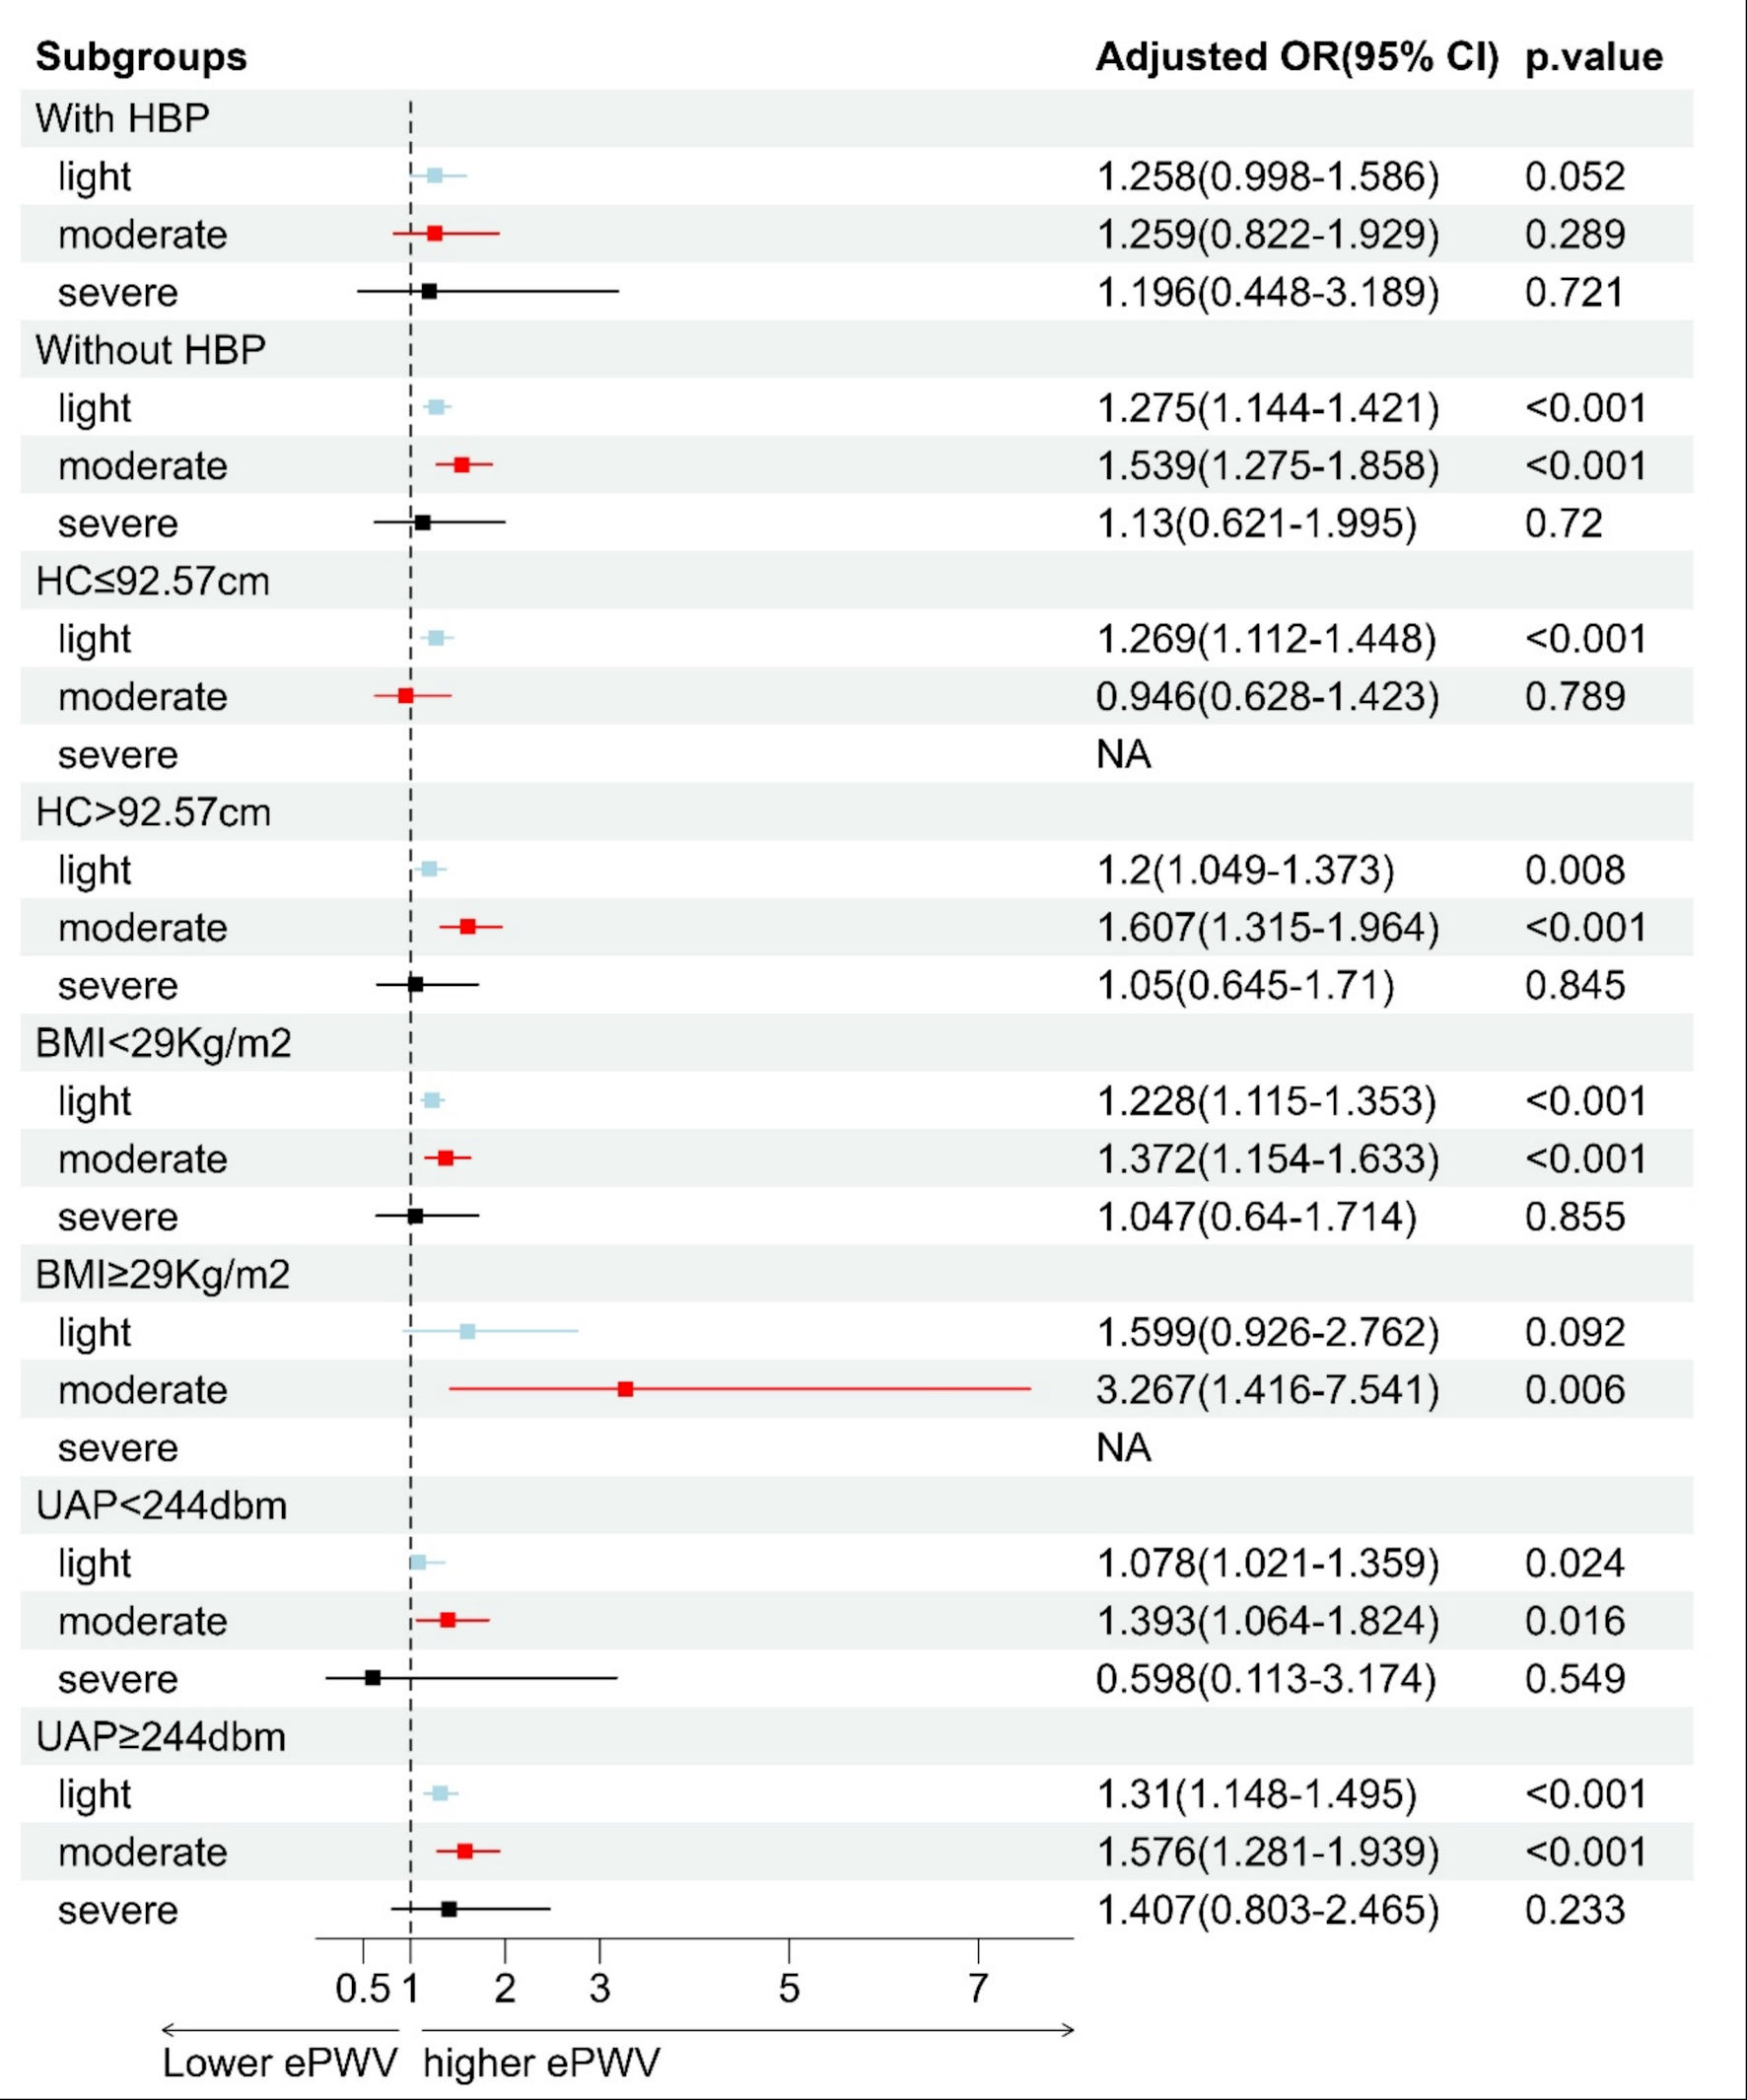
↓  Figure 3. Association of ePWV and liver fibrosis in different subgroups. The forest plot displays the adjusted odds ratios (ORs) and 95% confidence intervals (CIs) for the association between ePWV and liver fibrosis severity (light, moderate, and severe) across various clinical subgroups, adjusted for age, BMI, waist circumference, hip circumference, dyslipidemia, hypertension, CHD, COPD, DM/IGR, UAP, TG, ALT and AST. The vertical dashed line represents the unity line (OR = 1.0). Colored squares indicate point estimates: blue for light, red for moderate, and black for severe liver fibrosis, respectively. Horizontal lines represent the 95% CIs. P < 0.05 is considered statistically significant. Statistical significance (P < 0.05) is achieved when the 95% CI does not cross the unity line. Moderate liver fibrosis (red) and light fibrosis (blue) frequently demonstrated significant associations with higher ePWV (P < 0.05), whereas severe fibrosis (black) showed consistent positive trends but lacked statistical significance. MAFLD: metabolic dysfunction–associated fatty liver disease; ePWV: estimated pulse wave velocity; BMI: body mass index; UAP: ultrasonic attenuation parameter; HBP: high blood pressure; OR: odds ratio; CI: confidence interval; hs-CRP: hypersensitive C-reactive protein; HC: hip circumference (92.57 cm was the median value of HC in all subjects).
Figure 3.
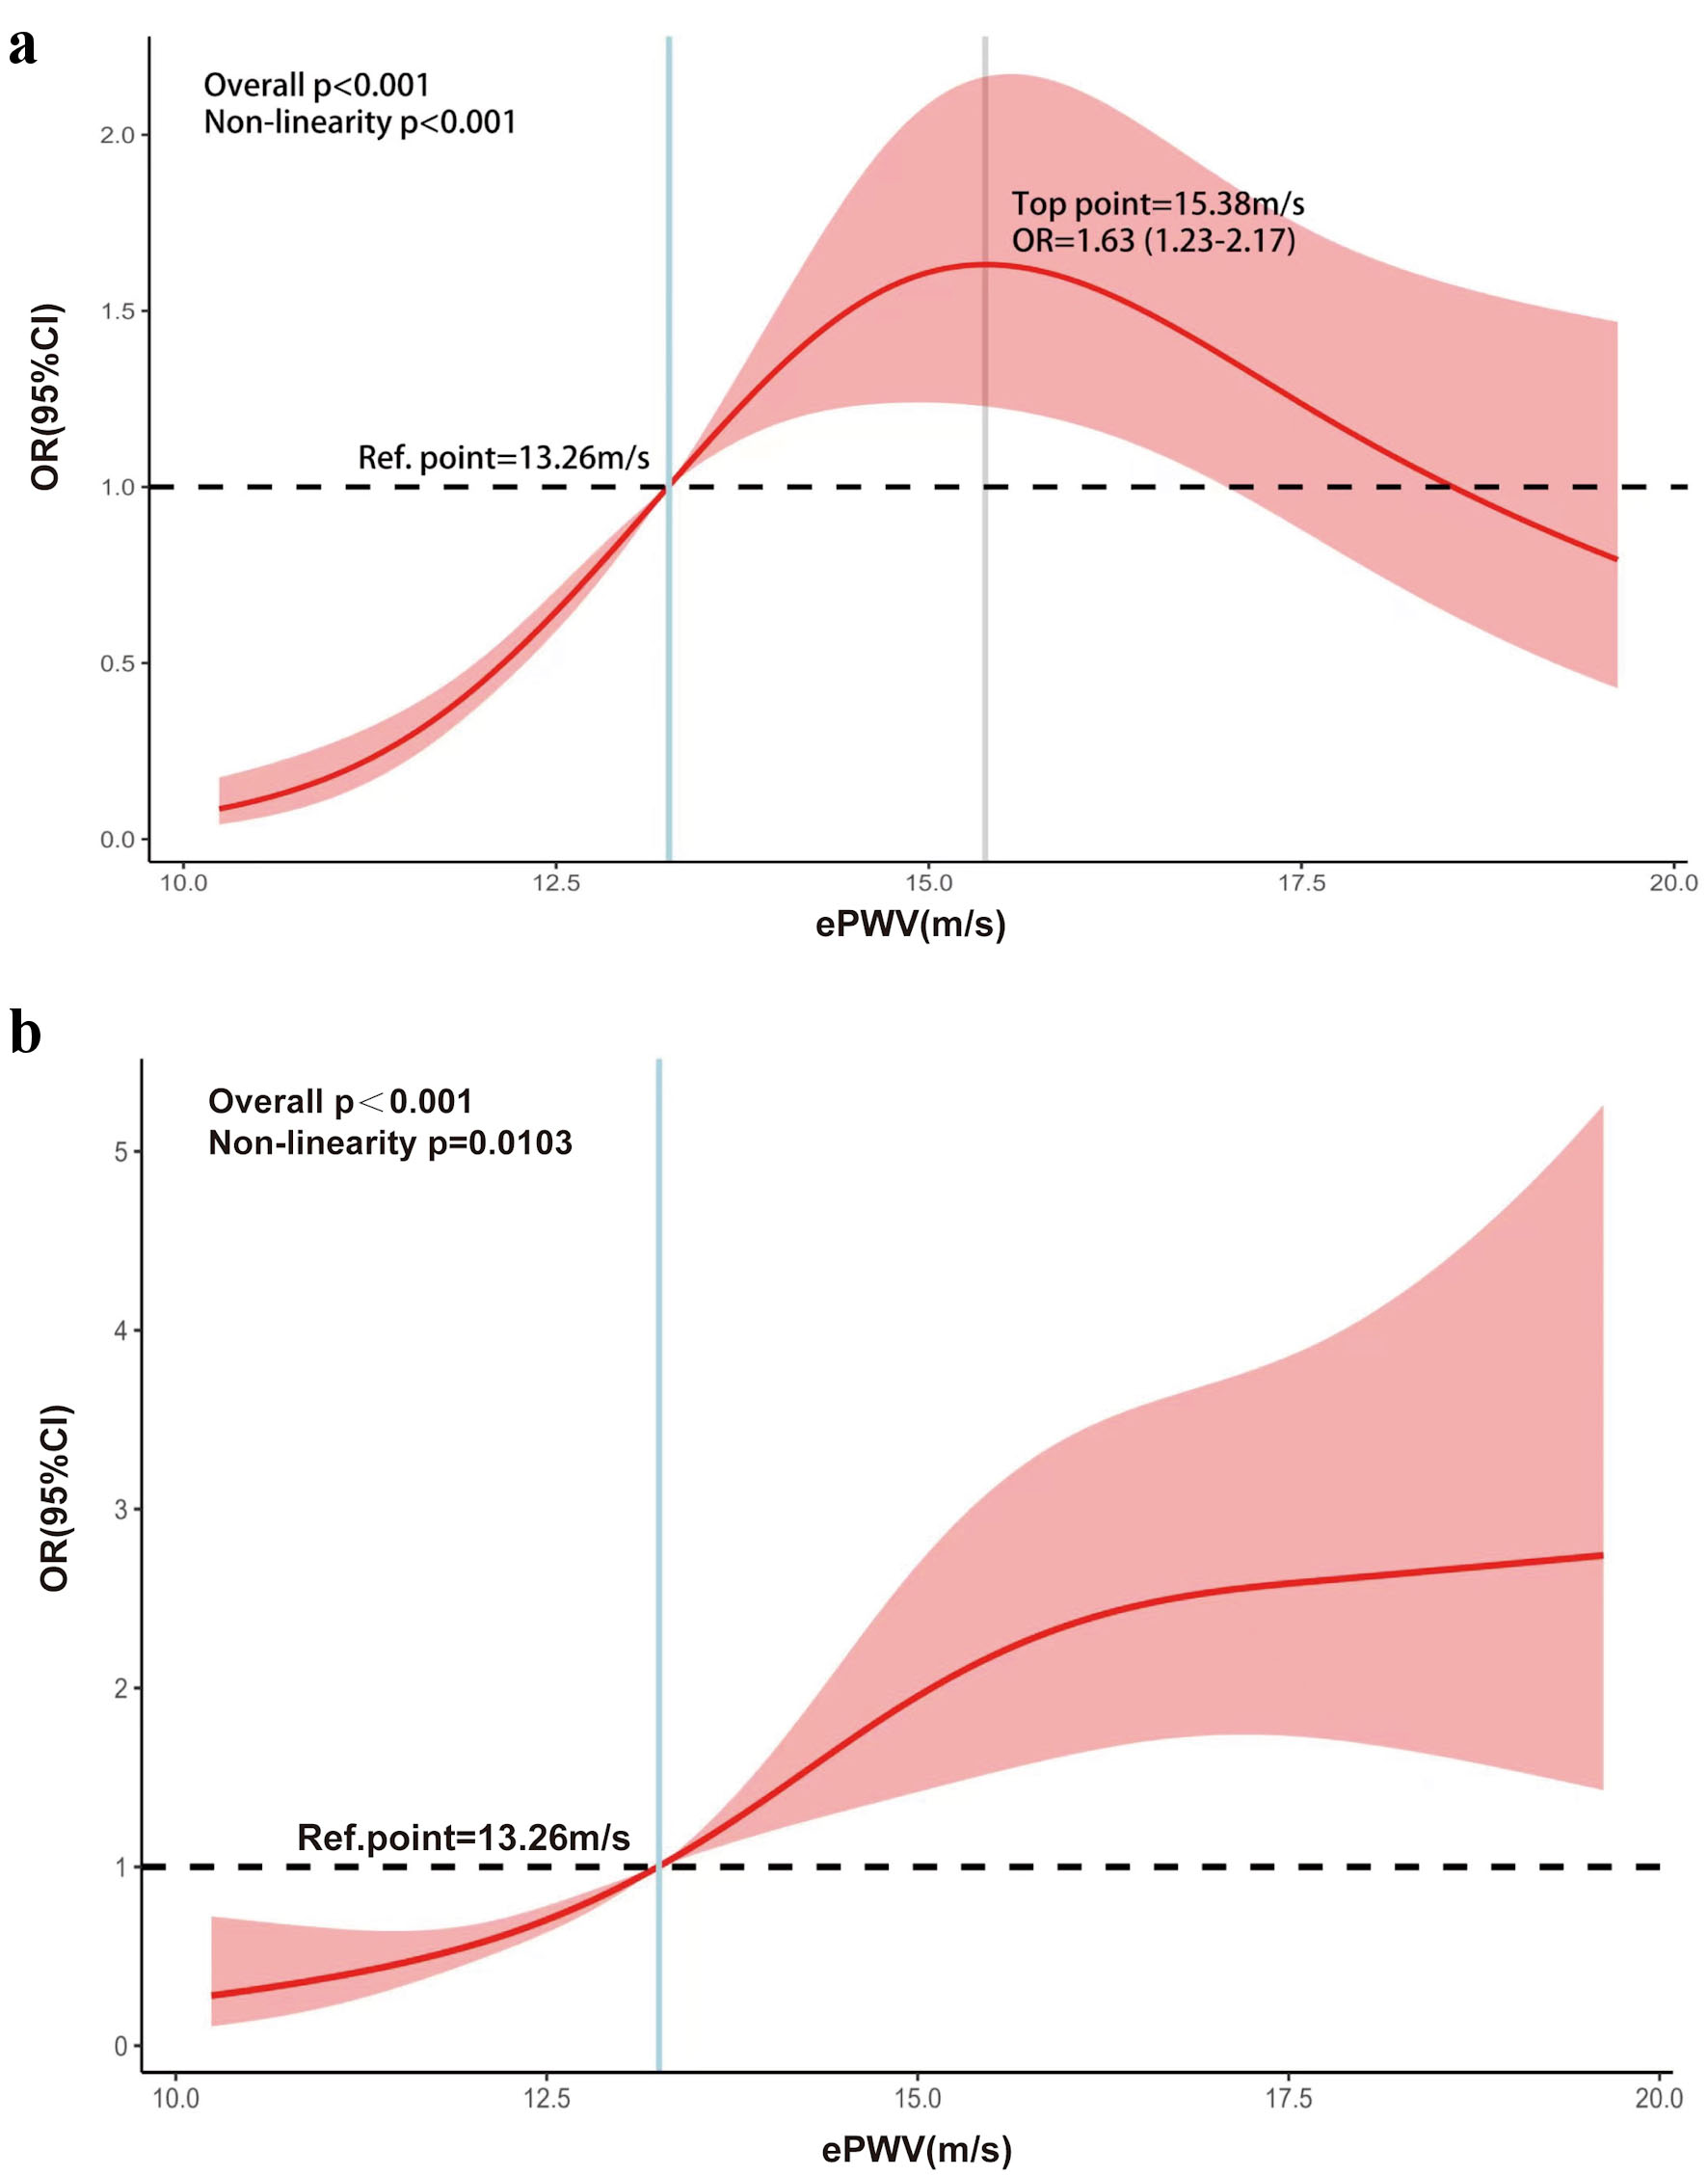
↓  Figure 4. Restricted cubic spline curves for the association between ePWV and MAFLD (a) or liver fibrosis (b). P < 0.05 was considered statistically significant. (a) The figure presented with a reversed “U” shape curve (overall P < 0.001; nonlinearity P < 0.001) and the maximum of OR was showed when ePWV was 15.38 m/s (OR = 1.63; 95% CI, 1.23–2.17). (b) The slope gradually decreased as ePWV increased (overall P < 0.001; nonlinearity P = 0.013). ePWV: estimated pulse wave velocity; MAFLD: metabolic dysfunction–associated fatty liver disease; OR: odds ratio; CI: confidence interval.
Figure 4.

Tables

↓  Table 1. Demographic Variables of Subjects
 
Non-MAFLDMAFLDZ/t2 (P)No liver fibrosisLiver fibrosisZ/t2 (P)
aContinuous data not on Gaussian distribution, reported as median (interquartile range (IQR)) and compared using Mann–Whitney U tests, and the statistic was Z. bCategorical data, reported as n (%), and compared using Chi-square test, and the statistic was χ2. cContinuous data on Gaussian distribution, reported as mean ± SD and compared using Student’s t-test, with t as the test statistic t. P < 0.05 was considered statistically significant. d1,108 subjects were included. e1,106 subjects were included. f1,105 subjects were included. MAFLD: metabolic dysfunction–associated fatty liver disease; BMI: body mass index; WC: waist circumference; HC: hip circumference; SBP: systolic blood pressure; DBP: diastolic pressure; HR: heart rate; CHD: coronary heart disease; COPD: chronic obstructive pulmonary disease; DM: diabetes mellitus; IGR: impaired glucose regulation; LLAs: lipid-lowering agents; UAP: ultrasonic attenuation parameter; LSM: liver stiffness measurement; TC: total cholesterol; TG: triacylglycerols; HDL-C: high-density lipoprotein cholesterol; LDL-C: low-density lipoprotein cholesterol; ALT: alanine aminotransferase; AST: aspartate aminotransferase; SCr: serum creatinine; hs-CRP: hypersensitive C-reactive protein; ePWV: estimated pulse wave velocity.
Num.n(%)613 (54.9)503 (45.1)886 (79.4)230 (20.6)
  Light232 (20.8)172 (15.4)
  Moderate202 (18.1)52 (4.7)
  Severe69 (6.2)6 (0.5)
Age (year)a47 (34, 68)66.00 (50, 71)−8.973 (< 0.001)47 (34, 68)66 (50, 71)−8.165 (< 0.001)
Genderb26.762 (< 0.001)10.267 (< 0.001)
  Male147 (24.0)193 (38.3)250 (28.2)90 (39.1)
  Female465 (76.0)311 (61.7)636 (71.8)140 (60.9)
BMI (kg/m2)c22.55 ± 3.3725.03 ± 3.21−12.496 (< 0.001)23.25 ± 3.3525.28 ± 3.74−7.956 (< 0.001)
WC (cm)c77.15 ± 8.5883.88 ± 8.23−13.291 (< 0.001)79.15 ± 8.8284.19 ± 8.92−7.690 (< 0.001)
HC (cm)c90.79 ± 8.0095.17 ± 8.76−8.726 (< 0.001)91.95 ± 8.3995.87 ± 8.84−6.255 (< 0.001)
SBP (mm Hg)c120.69 ± 14.30128.28 ± 13.58−9.030 (< 0.001)122.68 ± 14.11129.65 ± 14.56−6.630 (< 0.001)
DBP (mm Hg)a75 (70, 80)78 (72, 82)−6.612 (< 0.001)75 (70, 80)78 (72, 82)−2.655 (0.008)
HR (bpm)c76.47 ± 8.7375.91 ± 7.451.144 (0.253)76.15 ± 8.3576.49 ± 7.53−0.557 (0.578)
Current drinkerb67 (10.9)62 (12.3)0.509 (0.475)98 (11.1)31 (13.5)1.044 (0.307)
Current smokerb24 (3.9)36 (7.1)5.669 (0.017)50 (5.6)10 (4.3)0.602 (0.438)
Secondhand smokerb152 (25.0)122 (24.2)0.084 (0.771)216 (24.4)59 (25.7)0.159 (0.690)
Salt intake (g/d)a6 (6, 6)6 (6, 7)−1.848 (0.065)6 (6, 6)6 (6, 7)−0.493 (0.622)
Physical activity (min/d)a60.00 (30.00, 60.00)60.00 (30.00, 60.00)−0.323 (0.747)60 (30, 60)60 (30, 69)−0.944 (0.345)
Sedentary time (min/day)a300 (180, 360)300 (180, 360)−2.184 (0.029)5 (3, 6)5 (3, 6)−0.615 (0.539)
Medical historyb
  Dyslipidemia40 (6.5)75 (14.9)20.909 (< 0.001)79 (8.9)36 (15.7)8.963 (0.003)
  Hypertension71 (11.6)149 (29.6)56.541 (< 0.001)154 (17.4)66 (28.7)14.769 (< 0.001)
  CHD23 (3.8)30 (6.0)2.963 (0.085)33 (3.7)20 (8.7)9.975 (0.002)
  COPD3 (0.5)19 (3.8)15.416 (< 0.001)12 (1.4)10 (4.3)8.467 (0.004)
  Stroke10 (1.6)8 (1.6)0.003 (0.954)11 (1.2)0.7 (3.0)3.736 (0.053)
  DM/IGR192 (31.3)194 (38.5)6.289 (0.012)291 (32.8)95 (41.3)5.777 (0.016)
  Hyperuricemia13 (2.1)18 (3.6)2.157 (0.142)22 (2.5)9 (3.9)1.383 (0.240)
UAP (db/m)c210.94 ± 22.73273.34 ± 20.24233.59 ± 35.02260.12 ± 40.95−9.871 (< 0.001)
LSM (kPa)a5.6 (4.8, 6.9)7.0 (5.6, 8.7)−10.899 (< 0.001)5.6 (4.8, 6.9)7.0 (5.6, 8.7)
TC (mmol/L)c, d4.66 ± 0.964.90 ± 1.16−3.626 (< 0.001)4.76 ± 1.044.81 ± 1.16−0.594 (0.552)
TG (mmol/L)a, d1.1 (0.9, 1.5)1.4 (1.0, 1.9)−8.009 (< 0.001)21 (16, 27)23 (19, 29)−4.244 (< 0.001)
LDL-C (mmol/L)c, d2.78 ± 0.882.88 ± 0.90−1.957 (0.051)2.80 ± 0.872.90 ± 0.94−1.490 (0.137)
HDL-C (mmol/L)c, d1.50 ± 0.511.46 ± 0.491.521 (0.128)1.49 ± 0.511.46 ± 0.480.748 (0.455)
ALT(U/L)c, e21.28 ± 12.2725.26 ± 14.05−5.029 (< 0.001)22.38 ± 12.9625.75 ± 13.99−3.449 (< 0.001)
AST(U/L)a, e21 (16, 27)23 (19, 29)−4.537 (< 0.001)21 (16, 27)23 (19, 29)−4.029 (< 0.001)
SCr (µmol/L)c, f71.17 ± 42.8275.26 ± 34.37−1.725 (0.085)72.47 ± 41.2375.10 ± 30.57−0.904 (0.366)
hs-CRP (mg/L)a, f3.3 (0.8, 5.4)4.0 (1.4, 6.0)−3.410 (< 0.001)3.3 (0.8, 5.4)4.0 (1.4, 6.0)−1.732 (0.083)
ePWV (m/s)a12.20 (11.28, 14.68)14.63 (12.86, 16.24)−11.616 (< 0.001)12.20 (11.28, 14.68)14.63 (12.68, 16.24)−9.293 (< 0.001)


↓  Table 2. Association of ePWV With MAFLD and Liver Fibrosis
 
Crude OR (95% CI)PAdjusted OR (95% CI)aP
aIn analyses for MAFLD, adjusted for age, BMI, waist circumference, hip circumference, current smoker, sedentary time, dyslipidemia, hypertension, COPD, diabetes, DM/IGR, LSM, TC, TG, ALT, AST and hs-CRP. In analyses for liver fibrosis, adjusted for gender, age, BMI, waist circumference, hip circumference, SBP, DBP, dyslipidemia, hypertension, CHD, COPD, DM/IGR, UAP, TG, ALT and AST. P < 0.05 was considered statistically significant. Reference groups: non-MAFLD for the MAFLD analysis and no liver fibrosis for the liver fibrosis analysis. ePWV: estimated pulse wave velocity; MAFLD: metabolic dysfunction–associated fatty liver disease; OR: odds ratio; CI: confidence interval.
MAFLD (vs. non-MAFLD)
  Light1.213 (1.134–1.298)< 0.0011.047 (0.957–1.145)0.320
  Moderate1.396 (1.299–1.500)< 0.0011.130 (1.025–1.246)0.014
  Severe1.511 (1.356–1.684)< 0.0011.170 (0.992–1.380)0.062
Liver fibrosis (vs. no liver fibrosis)
  Light1.294 (1.207–1.388)< 0.0011.245 (1.117–1.388)< 0.001
  Moderate1.427 (1.267–1.606)< 0.0011.494 (1.248–1.789)< 0.001
  Severe1.374 (0.989–1.909)0.0581.127 (0.682–1.863)0.641