Figures
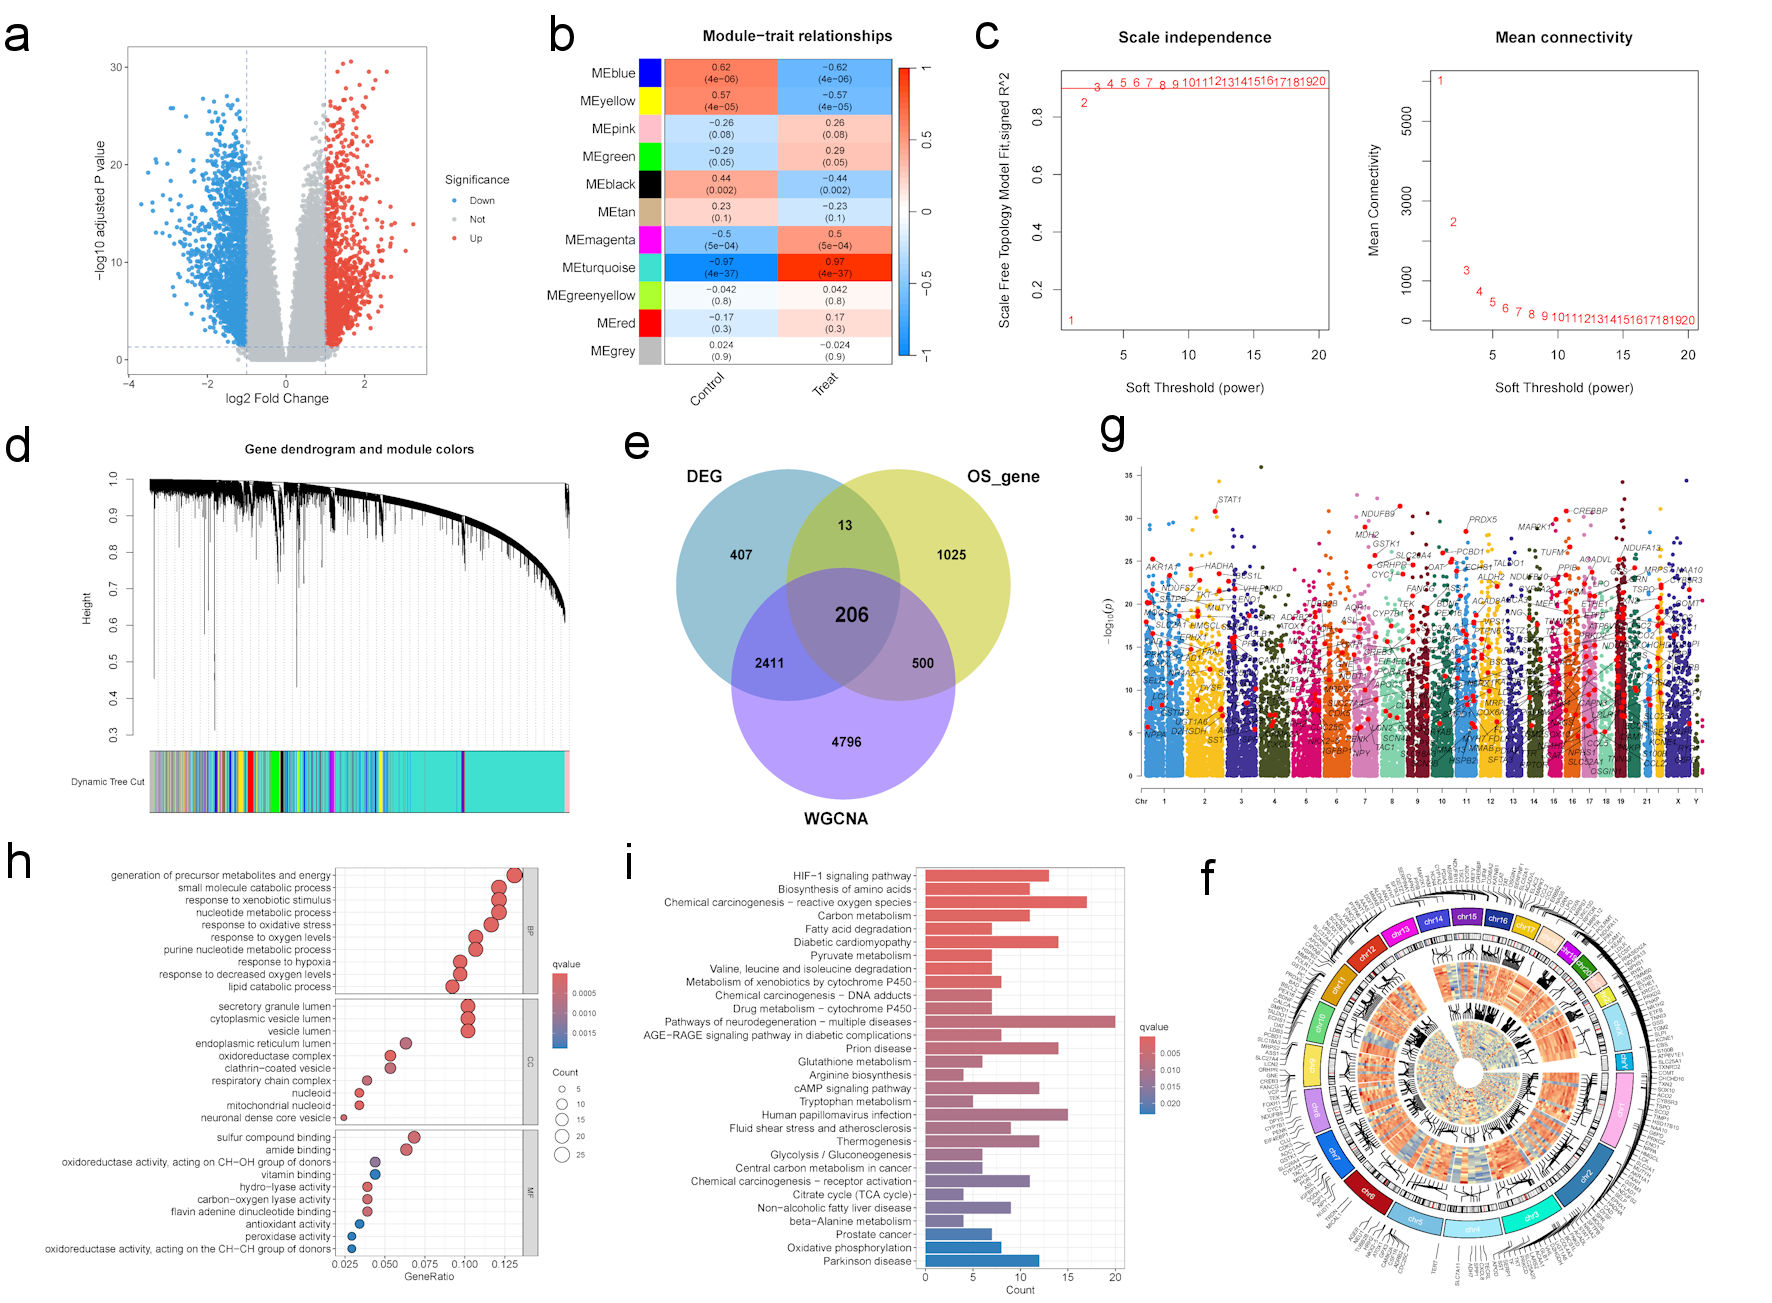
↓ Figure 1. Integrated identification and functional characterization of oxidative stress–related differentially expressed genes in IBS-D. (a) Volcano plot of DEGs in the GSE36701 dataset. (b–d) WGCNA analysis of identifying candidate genes. (b) The clustered modules of WGCNA. (c) The soft threshold power and the mean connectivity of WGCNA. (d) The cluster dendrogram of WGCNA. (e) Venn diagram showing the intersection among DEGs, oxidative stress–related genes, and genes from clinically relevant WGCNA modules. (f) Circos plot showing the chromosomal locations of the oxidative stress–related DEGs. (g) Manhattan plot displaying the chromosomal significance distribution of DEGs. (h, i) Enrichment analysis of oxidative stress–related DEGs. (h) GO enrichment analysis. (i) KEGG enrichment analysis. DEGs: differentially expressed genes; GO: Gene Ontology; IBS-D: diarrhea-predominant irritable bowel syndrome; KEGG: Kyoto Encyclopedia of Genes and Genomes; WGCNA: weighted gene coexpression network analysis.
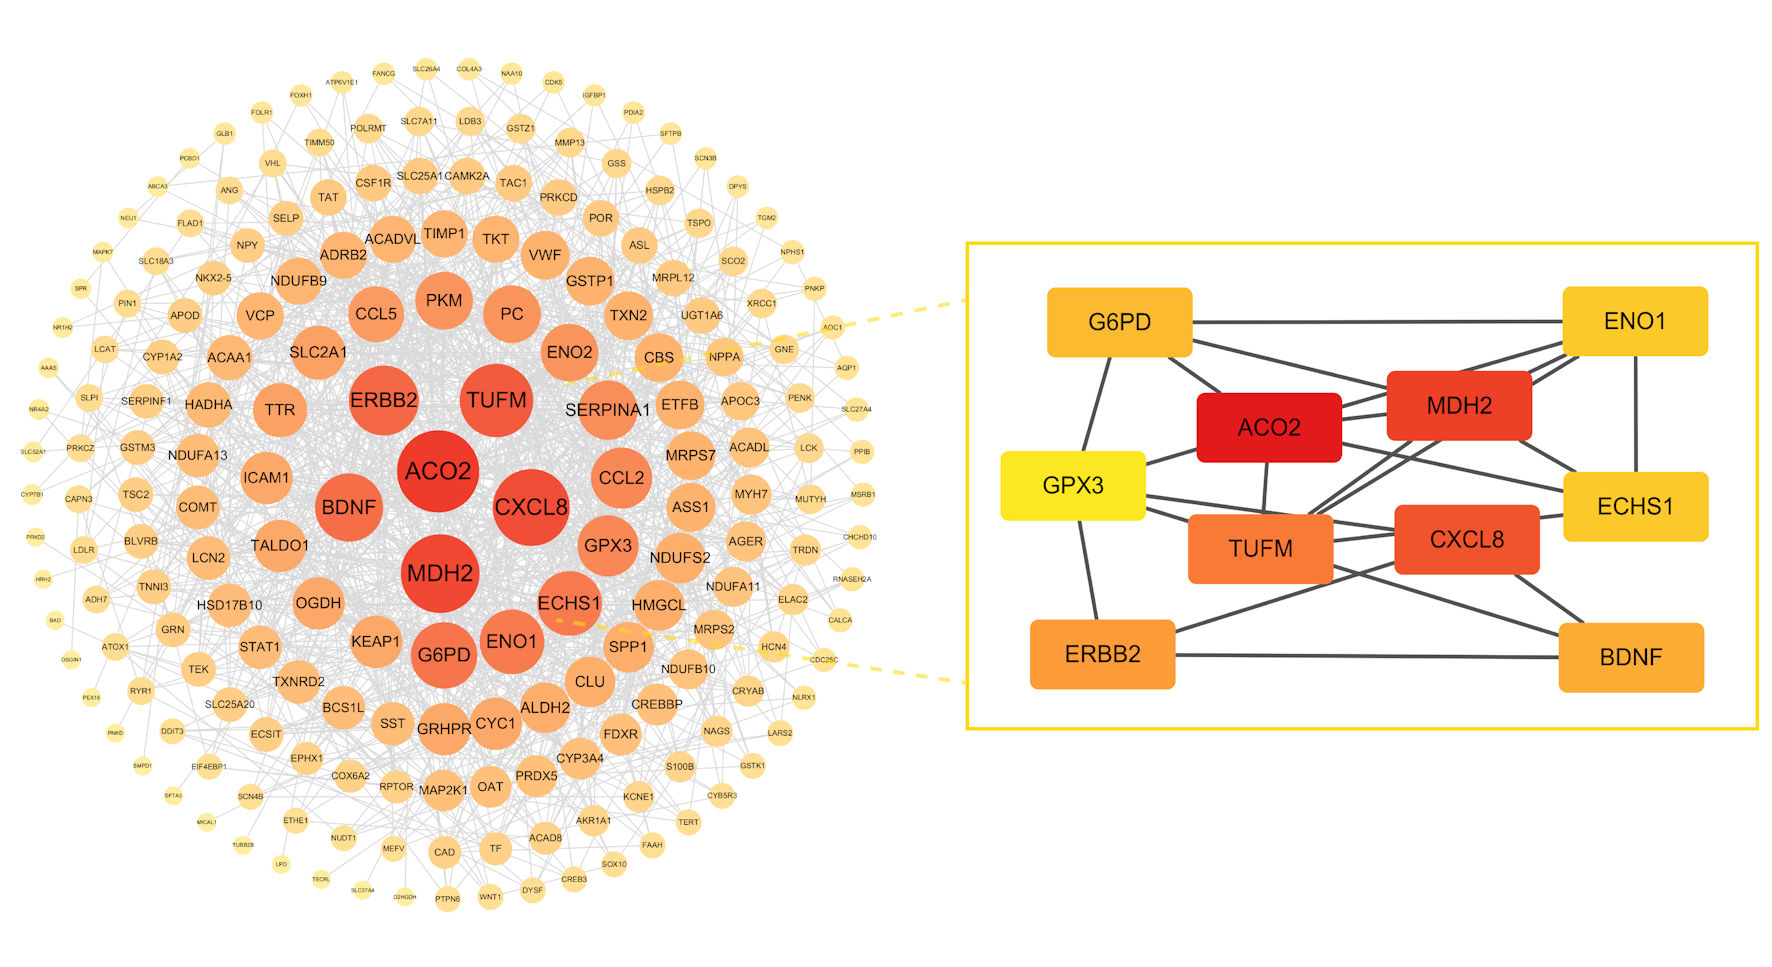
↓ Figure 2. Construction of protein–protein interaction (PPI) network and identification of 10 hub genes.
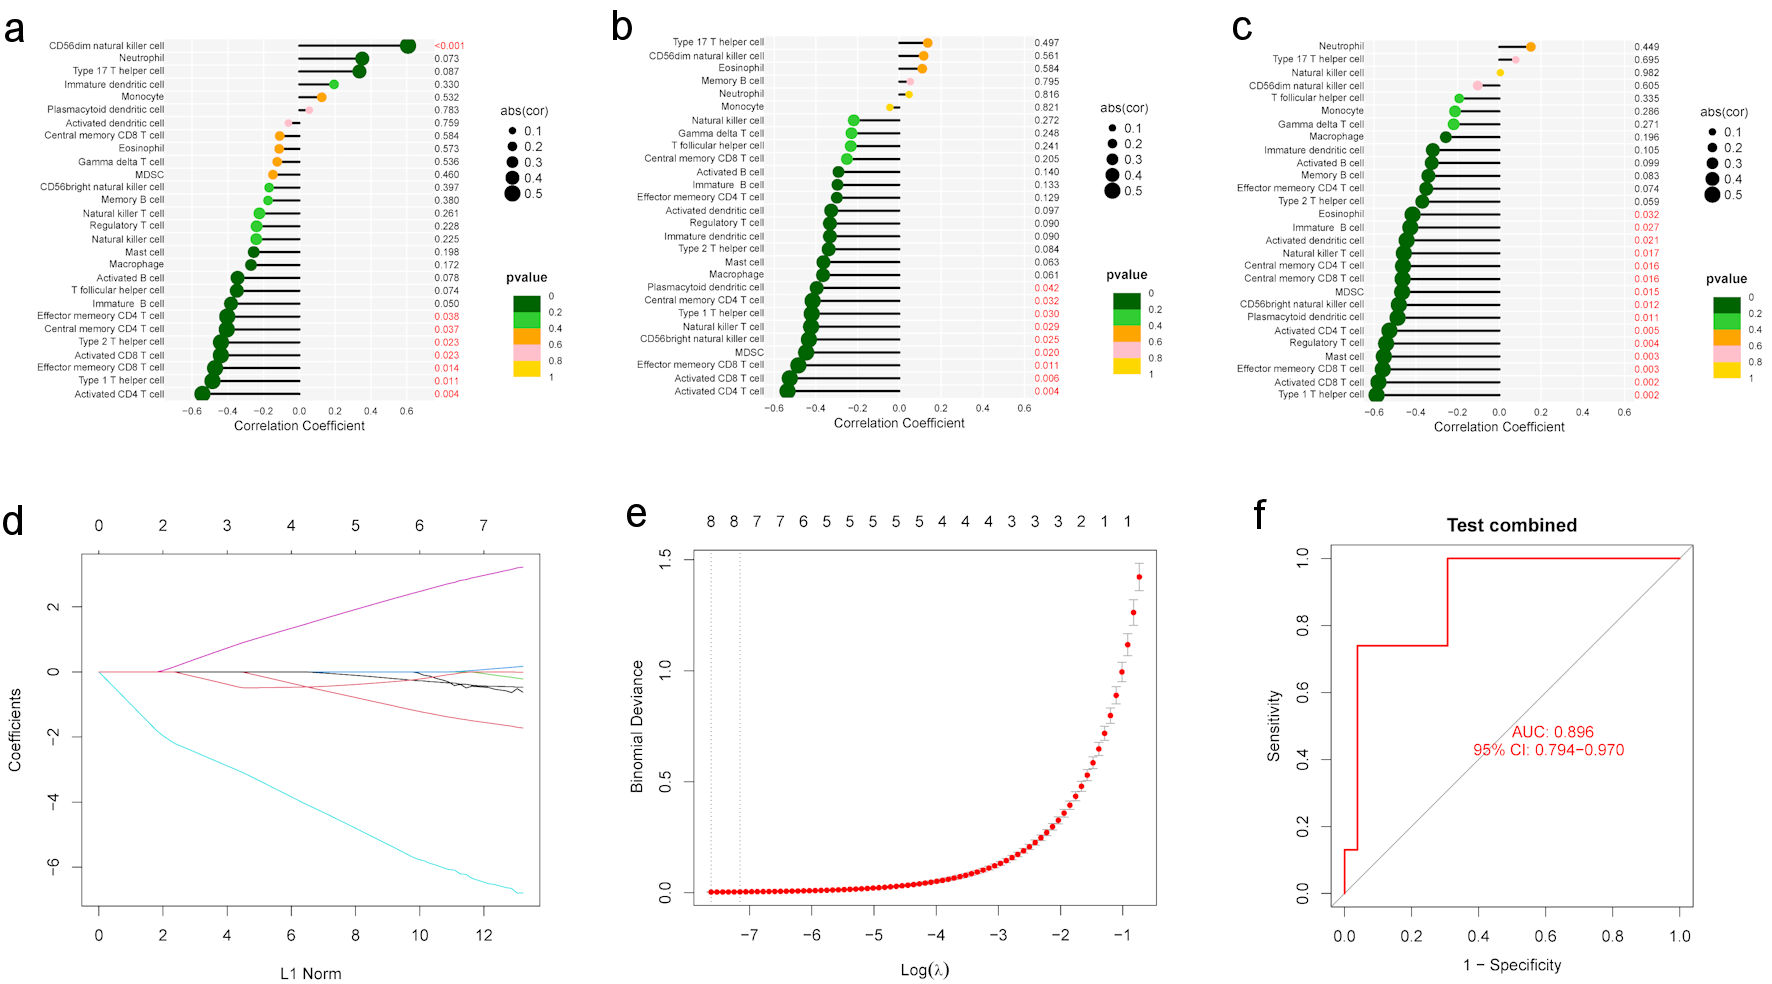
↓ Figure 3. Immune cell correlation analysis and construction of a diagnostic model. (a–c) Correlation between hub genes and infiltrating immune cells. (a) Correlation between ACO2 and infiltrating immune cells. (b) Correlation between BDNF and infiltrating immune cells. (c) Correlation between ERBB2 and infiltrating immune cells. (d, e) The LASSO regression process for feature selection. (d) LASSO path plot. (e) LASSO cross-validation error plot. (f) Diagnostic performance of the eight core targets in distinguishing normal and IBS-D samples, as evaluated by receiver operating characteristic (ROC) analysis in the GSE166869 dataset. LASSO: least absolute shrinkage and selection operator; IBS-D: diarrhea-predominant irritable bowel syndrome.
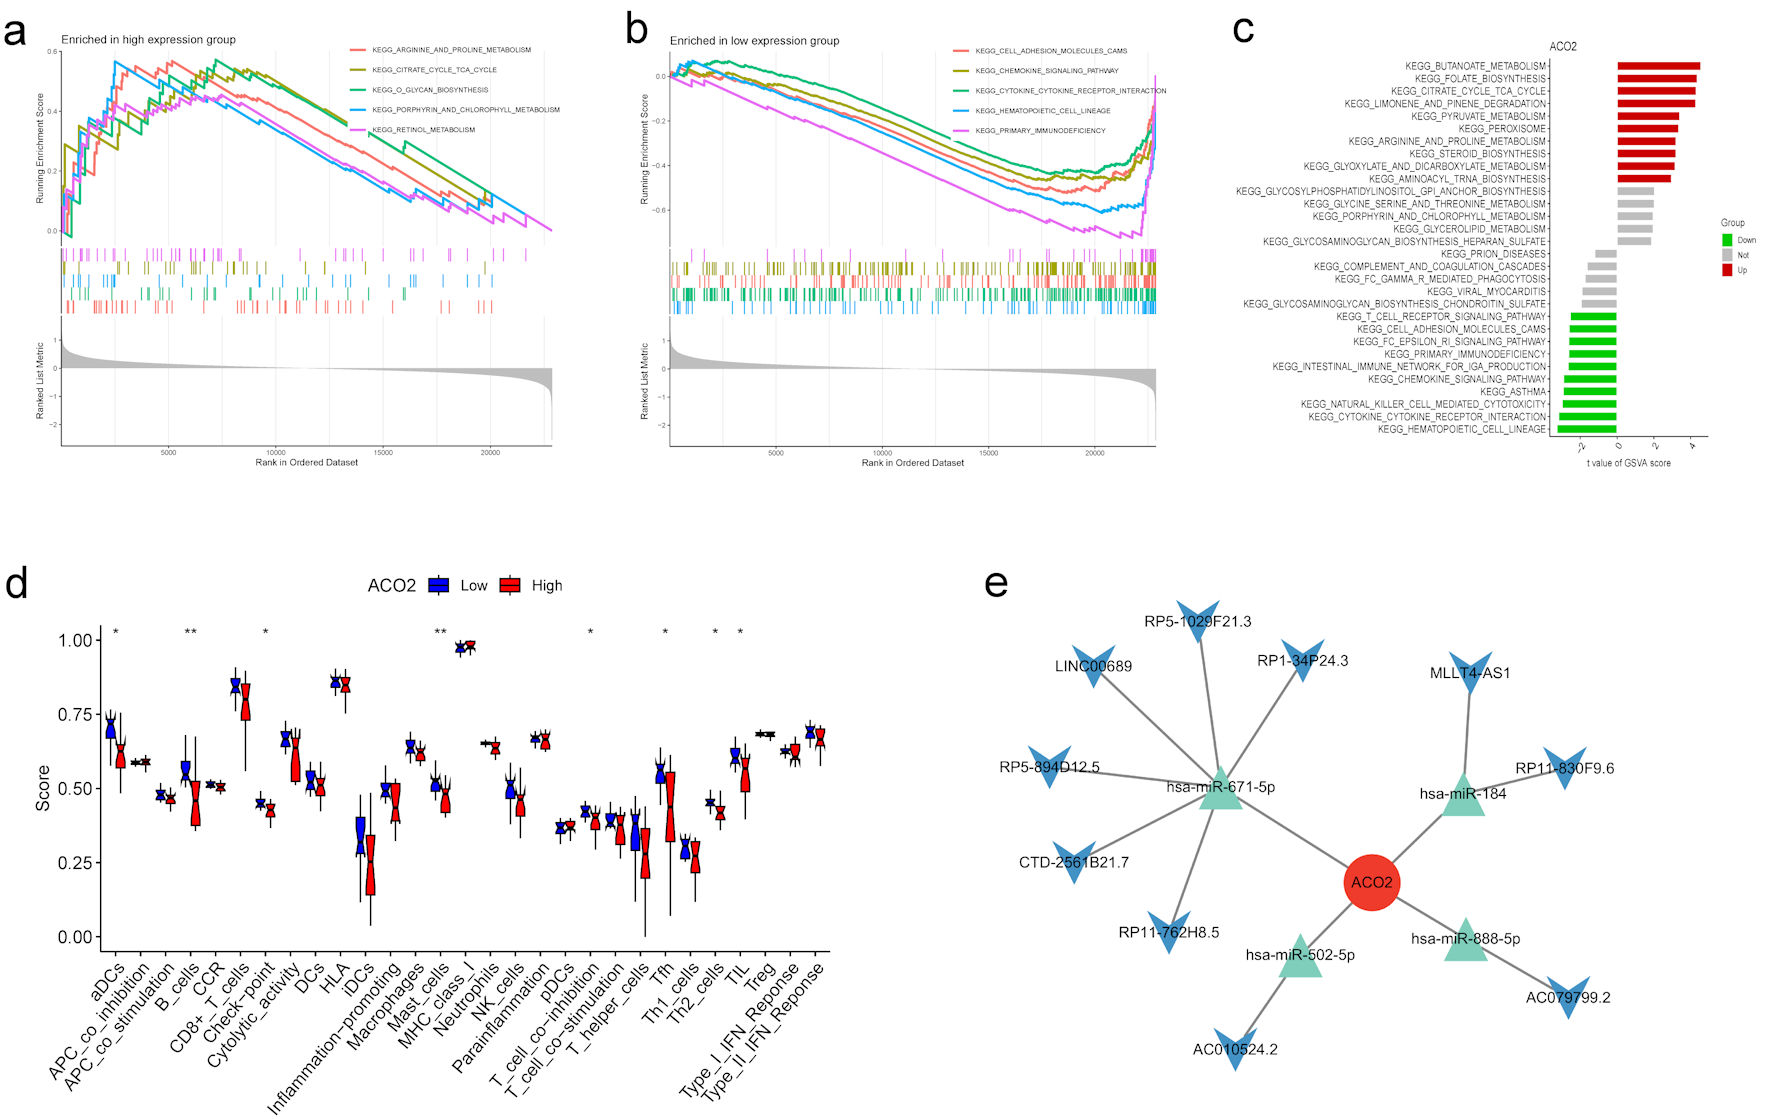
↓ Figure 4. Functional enrichment analysis and immune landscape associated with ACO2 expression in IBS-D. (a, b) Gene set enrichment analysis. (a) GSEA enrichment results of ACO2 high expression group. (b) GSEA enrichment results of ACO2 low expression group. (c) Gene set variation analysis (GSVA) of differential pathway enrichment between groups. (d) Comparison of ssGSEA Immune score among ACO2 high- and low-expression groups. (e) The ceRNA network illustrating the interactions among ACO2, related miRNAs, and lncRNAs. IBS-D: diarrhea-predominant irritable bowel syndrome; GSEA: gene set enrichment analysis; GSVA: gene set variation analysis; ssGSEA: single-sample gene set enrichment analysis; ceRNA: competing endogenous RNA; lincRNAs: long noncoding RNAs.
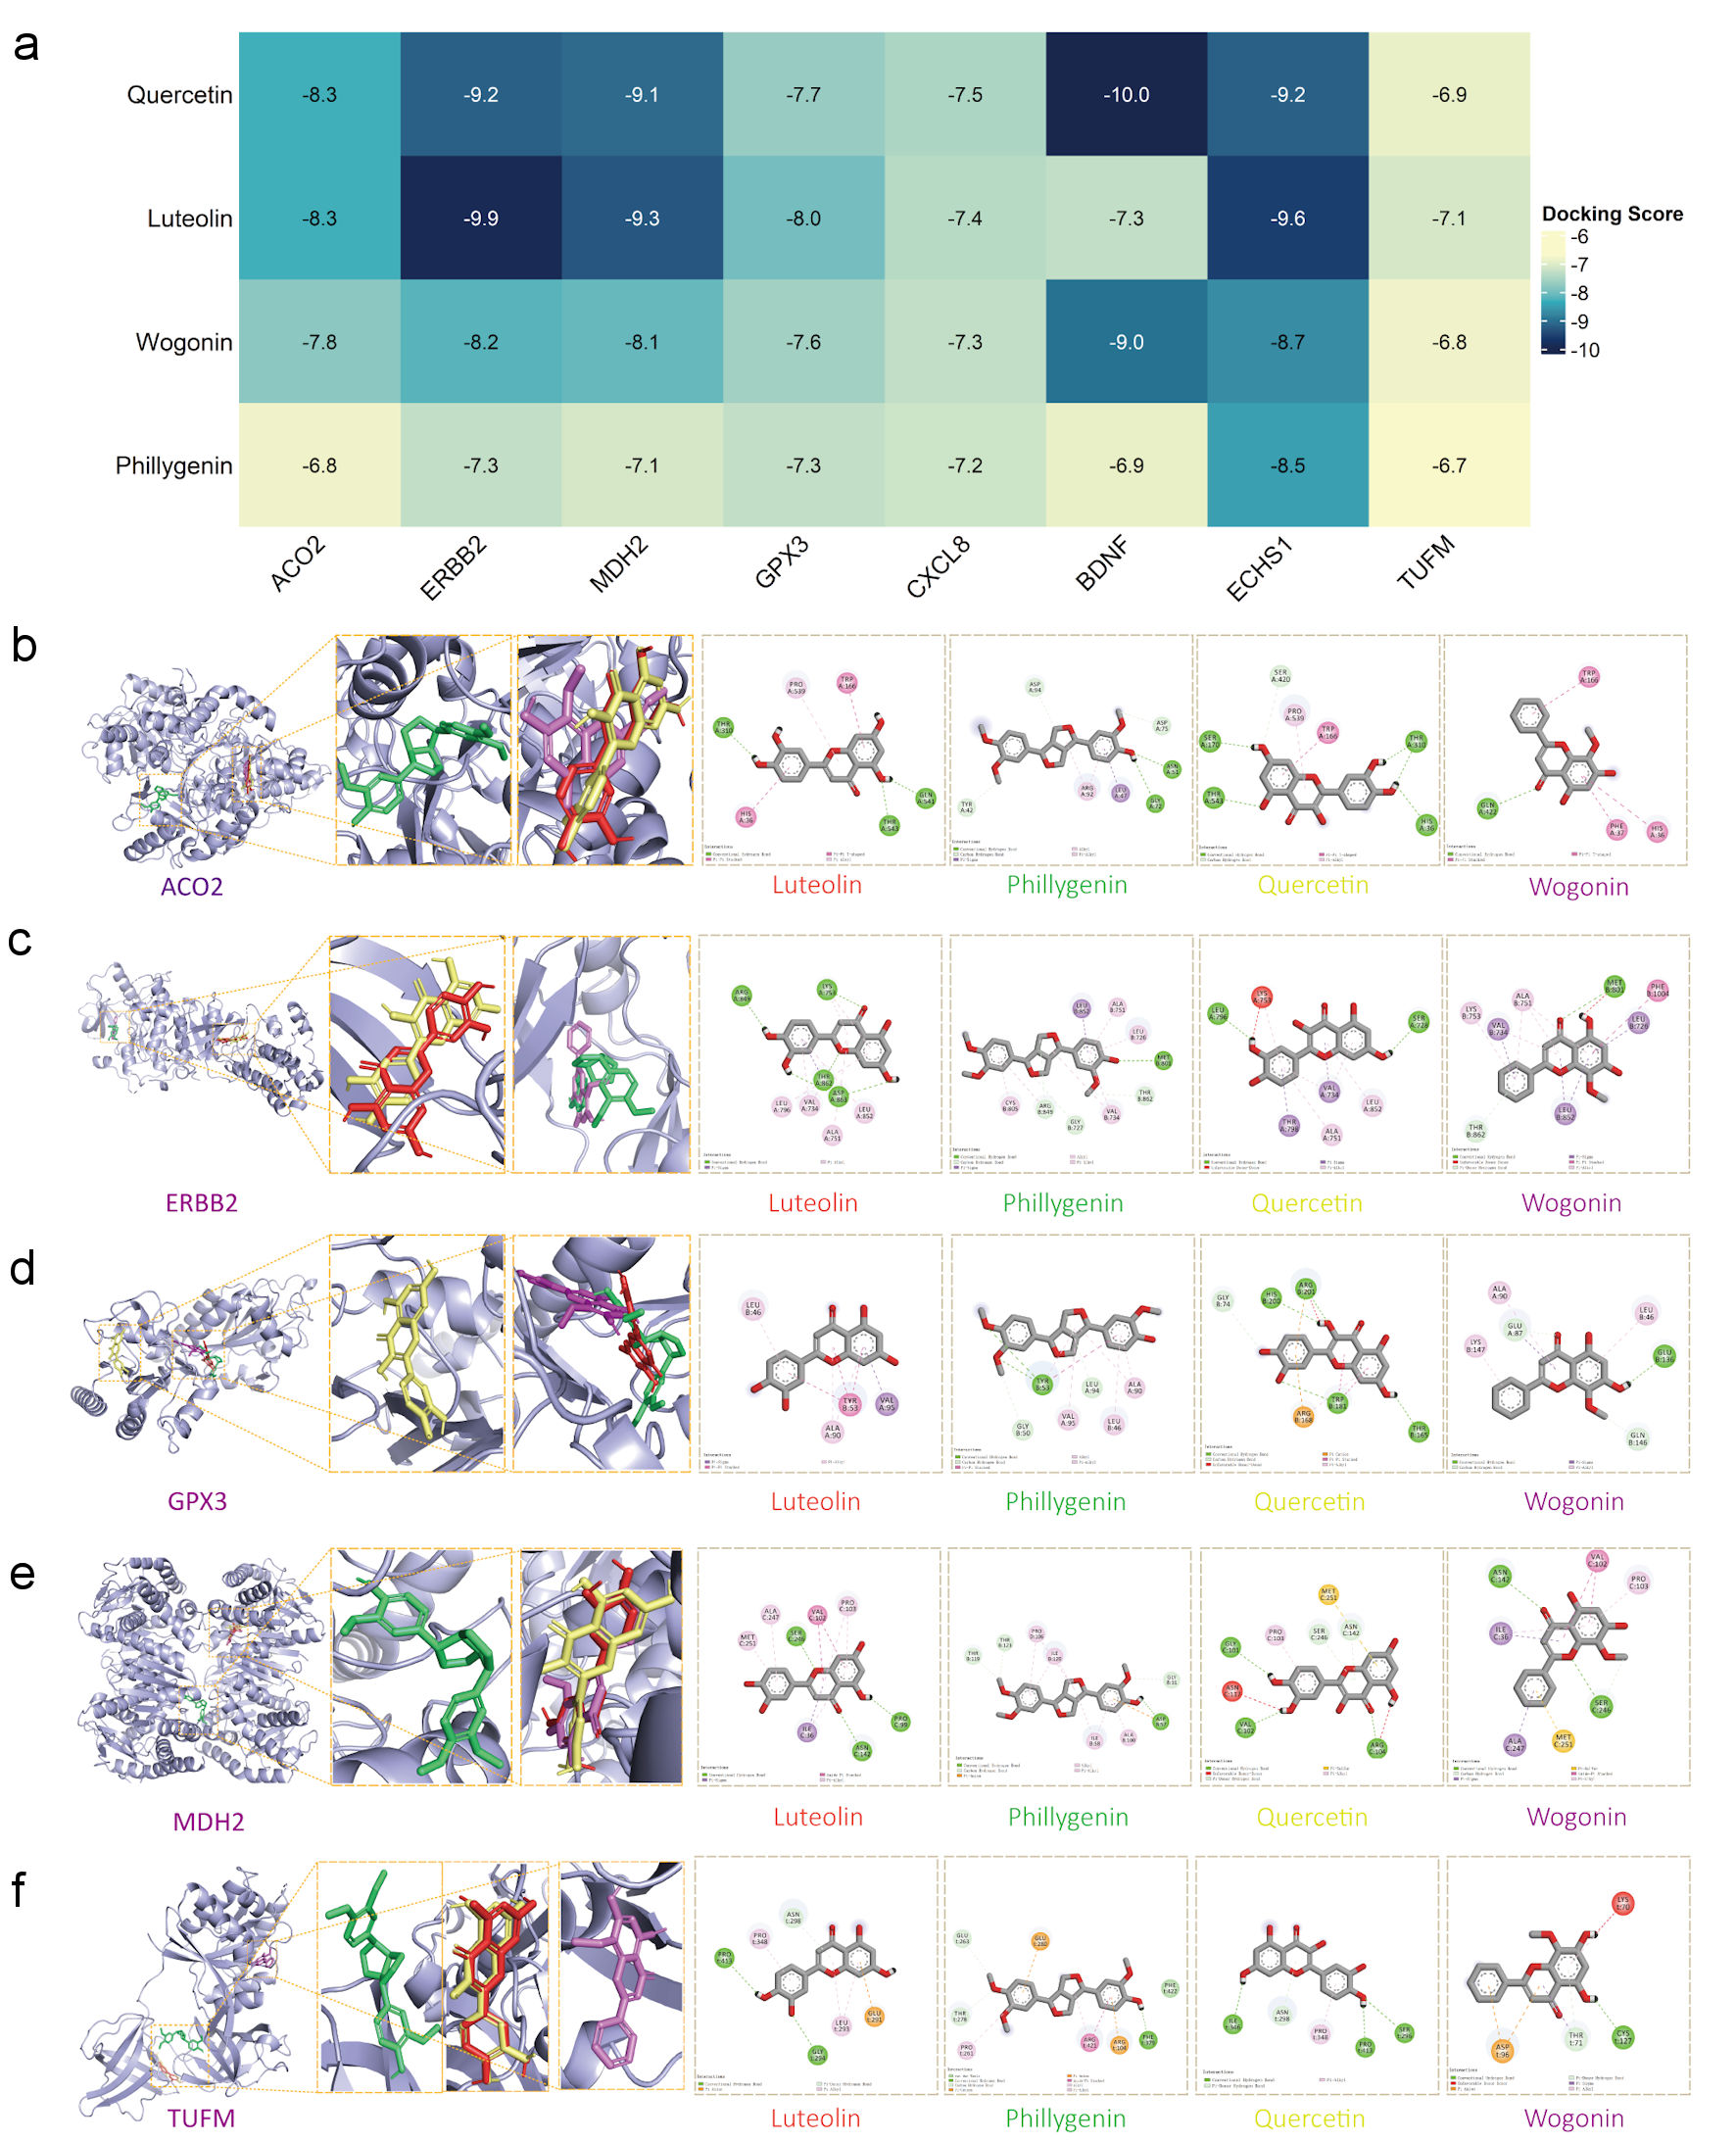
↓ Figure 5. Prediction of interactions between potential active compounds and core proteins by molecular docking analysis. (a) Heatmap of molecular docking binding energies. Lower binding energies represented by yellow modules and higher binding energies represented by blue modules. (b–f) Structural diagrams of active compound–target protein complexes. The magnified three-dimensional (3D) diagrams show the binding sites of the four compounds within the protein pockets, while the two-dimensional (2D) diagrams illustrate the intermolecular interaction bonds between the compounds and target proteins. ACO2: aconitase 2/aconitate hydratase; BDNF: brain-derived neurotrophic factor; ERBB2: erb-b2 receptor tyrosine kinase 2; GPX3: glutathione peroxidase 3; MDH2: malate dehydrogenase 2; TUFM: Tu translation elongation factor, mitochondrial.
Tables
↓ Table 1. List of Identified Potential Biomarkers and Their Regulation
| Number | Gene symbol | Description | Regulation |
|---|
| Up: upregulated genes; Down: downregulated genes. |
| 1 | ACO2 | Aconitate hydratase | Down |
| 2 | ERBB2 | Receptor tyrosine-protein kinase erbB-2 | Down |
| 3 | MDH2 | Malate dehydrogenase | Down |
| 4 | GPX3 | Glutathione peroxidase 3 | Down |
| 5 | CXCL8 | Interleukin-8 | Up |
| 6 | BDNF | Brain-derived neurotrophic factor | Up |
| 7 | ECHS1 | Enoyl-CoA hydratase | Down |
| 8 | TUFM | Elongation factor Tu, mitochondrial | Down |
↓ Table 2. Active Compounds of Forsythia suspensa Identified by Enrichment Analysis
| No. | Herb name | Compound name | TCMSP ID | PubChem CID | OB (%) | DL | Molecular weight (g/mol) | Molecular formula | Related targets | Selection |
|---|
| CID: compound identifier; DL: drug-likeness; OB: oral bioavailability; TCMSP: Traditional Chinese Medicine Systems Pharmacology Database and Analysis Platform; ACO2: aconitase 2/aconitate hydratase; BDNF: brain-derived neurotrophic factor; ERBB2: erb-b2 receptor tyrosine kinase 2; GPX3: glutathione peroxidase 3; MDH2: malate dehydrogenase 2; CXCL8: interleukin-8. |
| 1 | Forsythia | Quercetin | MOL000098 | 5280343 | 46.43 | 0.28 | 302.23 | C15H10O7 | ERBB2/ACO2/GPX3/CXCL8/BDNF | Docking |
| 2 | Forsythia | Luteolin | MOL000006 | 5280445 | 36.16 | 0.25 | 286.24 | C15H10O6 | ERBB2/MDH2/GPX3/CXCL8 | Docking |
| 3 | Forsythia | Wogonin | MOL000173 | 5281703 | 30.68 | 0.23 | 284.26 | C16H12O5 | ERBB2/GPX3/CXCL8 | Docking |
| 4 | Forsythia | Phillygenin | MOL003330 | 3083590 | 95.04 | 0.57 | 372.4 | C21H24O6 | ACO2/MDH2/GPX3/CXCL8 | Docking |
| 5 | Forsythia | hyperforin | MOL003347 | 441298 | 44.03 | 0.60 | 536.8 | C35H52O4 | GPX3 | No |
| 6 | Forsythia | Phillyrin | MOL003305 | 101712 | 36.4 | 0.86 | 534.6 | C27H34O11 | GPX3 | No |