Gastroenterology Research, ISSN 1918-2805 print, 1918-2813 online, Open Access
Article copyright, the authors; Journal compilation copyright, Gastroenterol Res and Elmer Press Inc
Journal website https://gr.elmerpub.com

Original Article

Volume 000, Number 000, November 2026, pages 000-000


Non-Surgical Esophageal Injury in Critically Ill Patients: Clinical Characteristics, Complications, and Interdisciplinary Management

Figures

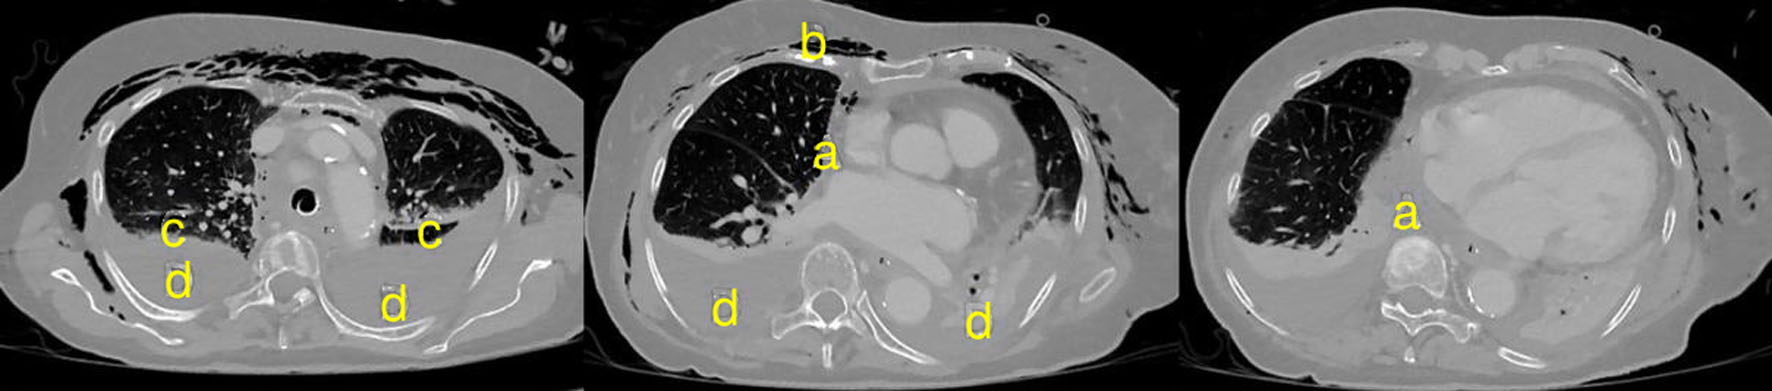
↓  Figure 1. Thoracic computed tomography in an 86-year-old patient approximately 48 h after esophageal perforation caused by transesophageal echocardiography. Paraesophageal and mediastinal fluid collections (a), cervicothoracic emphysema (b), subtotal atelectasis of both lower lobes (c), and bilateral pleural effusions (d) are visible.
Figure 1.
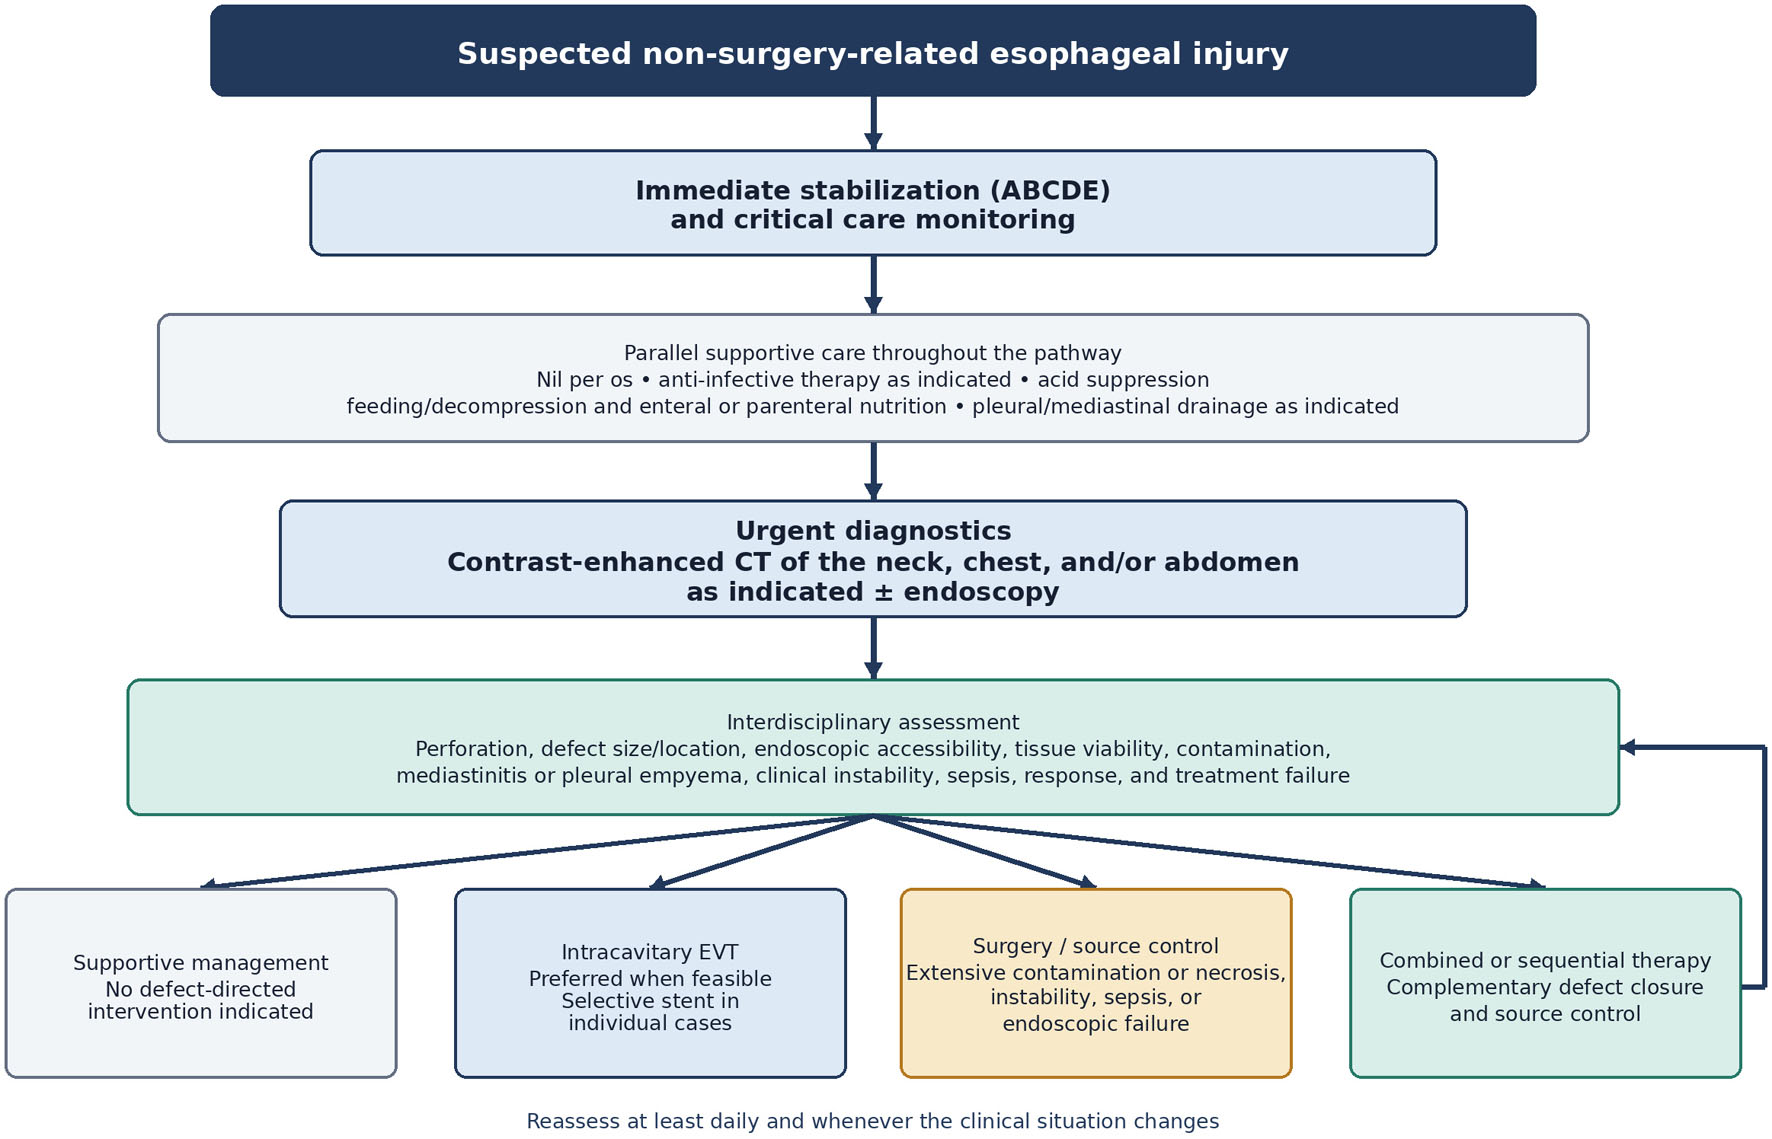
↓  Figure 2. Pragmatic, non-validated treatment pathway for patients with suspected non-surgery-related esophageal injury. Supportive measures continue throughout treatment. The pathway should be reassessed at least daily and whenever the clinical situation changes. ABCDE: airway, breathing, circulation, disability, and exposure; CT: computed tomography; EVT: endoscopic vacuum therapy.
Figure 2.

Tables

↓  Table 1. Patient Characteristics and Comorbidities
 
All, n = 42Without perforation, n = 20 (47.6%)With perforation, n = 22 (52.4%)Statistical comparison
Available-case data were used: weight, n = 31; height and BMI, n = 20. Confirmed esophageal perforation was present in 22 patients (52.4%). Patients with perforation were more frequently male (72.7% vs. 30.0%; P = 0.012), and mechanical injury was more common in patients with perforation (95.5% vs. 70.0%; P = 0.041). Intrathoracic complications were also more frequent in the perforation group, including mediastinitis (50.0% vs. 5.0%; P = 0.002) and pleural empyema (36.4% vs. 0.0%; P = 0.004). BMI: body mass index; IQR: interquartile range; U: Mann–Whitney U statistic.
Age, years, median (IQR)61 (51–74)62 (55–76)60 (47–72)U = 195.0; P > 0.05
Sex, n (%)Male 22 (52.4); Female 20 (47.6)Male 6 (30.0); Female 14 (70.0)Male 16 (72.7); Female 6 (27.3)Fisher exact; P = 0.012
Weight, kg, median (IQR)74 (65–90)75 (62–91)71 (67–90)U = 118.0; P > 0.05
Height, m, median (IQR)1.73 (1.69–1.79)1.73 (1.67–1.75)1.74 (1.70–1.85)U = 65.5; P > 0.05
BMI, kg/m2, median (IQR)24.0 (22.8–29.7)24.3 (21.9–30.5)23.7 (22.9–27.3)U = 48.5; P > 0.05
Arterial hypertension, n (%)18 (42.9)10 (50.0)8 (36.4)Fisher exact; P = 0.533
Non-esophageal neoplasia, n (%)2 (4.8)1 (5.0)1 (4.5)Fisher exact; P = 1.000
Psychiatric disease, n (%)10 (23.8)7 (35.0)3 (13.6)Fisher exact; P = 0.152
Chronic obstructive pulmonary disease, n (%)1 (2.4)1 (5.0)0 (0.0)Fisher exact; P = 0.476
Pulmonary embolism, n (%)1 (2.4)1 (5.0)0 (0.0)Fisher exact; P = 0.476
Peripheral arterial occlusive disease, n (%)5 (11.9)1 (5.0)4 (18.2)Fisher exact; P = 0.346
Chronic kidney disease, n (%)3 (7.1)0 (0.0)3 (13.6)Fisher exact; P = 0.233
Heart failure, n (%)3 (7.1)2 (10.0)1 (4.5)Fisher exact; P = 0.598
Valvulopathy, n (%)3 (7.1)1 (5.0)2 (9.1)Fisher exact; P = 1.000
Type 2 diabetes mellitus, n (%)6 (14.3)3 (15.0)3 (13.6)Fisher exact; P = 1.000
Coronary artery disease, n (%)5 (11.9)2 (10.0)3 (13.6)Fisher exact; P = 1.000
Stroke, n (%)2 (4.8)1 (5.0)1 (4.5)Fisher exact; P = 1.000


↓  Table 2. Characteristics of Esophageal Injury and Associated Complications
 
All, n = 42Without perforation, n = 20 (47.6%)With perforation, n = 22 (52.4%)Statistical comparison
AKI: acute kidney injury.
Etiology of esophageal injury, n (%)Mechanical trauma 35 (83.3); Lye 4 (9.5); Acid 1 (2.4); Ulcer 1 (2.4); Unknown 1 (2.4)Mechanical trauma 14 (70.0); Lye 4 (20.0); Acid 1 (5.0); Ulcer 1 (5.0); Unknown 0 (0.0)Mechanical trauma 21 (95.5); Lye 0 (0.0); Acid 0 (0.0); Ulcer 0 (0.0); Unknown 1 (4.5)Mechanical vs. non-mechanical: Fisher exact; P = 0.041
Location of esophageal lesion, n (%)Cervical 8 (19.0); Thoracic 12 (28.6); Thoracoabdominal 5 (11.9); Abdominal 12 (28.6); Multiple segments/entire esophagus 5 (11.9)Cervical 6 (30.0); Thoracic 5 (25.0); Thoracoabdominal 3 (15.0); Abdominal 1 (5.0); Multiple segments/entire esophagus 5 (25.0)Cervical 2 (9.1); Thoracic 7 (31.8); Thoracoabdominal 2 (9.1); Abdominal 11 (50.0); Multiple segments/entire esophagus 0 (0.0)Fisher-Freeman-Halton exact; P = 0.001
Pleural empyema, n (%)8 (19.0)0 (0.0)8 (36.4)Fisher exact; P = 0.004
Mediastinitis, n (%)12 (28.6)1 (5.0)11 (50.0)Fisher exact; P = 0.002
Peritonitis, n (%)1 (2.4)0 (0.0)1 (4.5)Fisher exact; P = 1.000
Sepsis, n (%)10 (23.8)0 (0.0)10 (45.5)Fisher exact; P < 0.001
Septic shock, n (%)7 (16.7)0 (0.0)7 (31.8)Fisher exact; P = 0.009
Acute kidney injury, n (%)6 (14.3)0 (0.0)6 (27.3)Fisher exact; P = 0.022


↓  Table 3. Respiratory Support and Airway Interventions During the Intensive Care Unit Stay
 
All, n = 42Without perforation, n = 20 (47.6%)With perforation, n = 22 (52.4%)Statistical comparison
HFNO: high-flow nasal oxygen; IQR: interquartile range; NIV: noninvasive ventilation; U: Mann–Whitney U statistic.
Invasive ventilation, n (%)25 (59.5)8 (40.0)17 (77.3)Fisher exact; P = 0.027
Invasive ventilation on admission, n (%)15 (35.7)7 (35.0)8 (36.4)Fisher exact; P = 1.000
Duration of invasive ventilation among ventilated patients, days, median (IQR)4.0 (2.0–8.0)3.0 (3.0–4.3)4.0 (2.0–11.0)U = 60.0; P = 0.660
Tracheotomy, n (%)7 (16.7)3 (15.0)4 (18.2)Overall: Fisher exact; P = 1.000
  Percutaneous dilatational4 (57.1)3 (100.0)1 (25.0)
  Surgical3 (42.9)0 (0.0)3 (75.0)
HFNO, n (%)2 (4.8)0 (0.0)2 (9.1)Fisher exact; P = 0.489
NIV, n (%)6 (14.3)5 (25.0)1 (4.5)Fisher exact; P = 0.087


↓  Table 4. Pulmonary and Respiratory Complications
 
All, n = 42Without perforation, n = 20 (47.6%)With perforation, n = 22 (52.4%)Statistical comparison
Respiratory failure, n (%)10 (23.8)0 (0.0)10 (45.5)Fisher exact; P < 0.001
Pneumonia, n (%)4 (9.5)1 (5.0)3 (13.6)Fisher exact; P = 0.608
Pleural effusion, n (%)14 (33.3)2 (10.0)12 (54.5)Fisher exact; P = 0.003
Chest tube placement, n (%)13 (31.0)2 (10.0)11 (50.0)Fisher exact; P = 0.007
Airway swelling, n (%)6 (14.3)5 (25.0)1 (4.5)Fisher exact; P = 0.087