| Gastroenterology Research, ISSN 1918-2805 print, 1918-2813 online, Open Access |
| Article copyright, the authors; Journal compilation copyright, Gastroenterol Res and Elmer Press Inc |
| Journal website https://gr.elmerpub.com |
Original Article
Volume 000, Number 000, March 2025, pages 000-000

Associations Between the HFE Genotypes and Iron Status Markers in an Apparently Healthy Population
Nils Thorm Milman ![]()
Department of Clinical Biochemistry, Naestved Hospital, University of Zealand, DK-4700 Naestved, Denmark
Manuscript submitted January 30, 2025, accepted March 7, 2025, published online March 18, 2025
Short title: HFE Genotypes and Iron Status Markers
doi: https://doi.org/10.14740/gr2021
| Abstract | ▴Top |
Background: The ethnic Danish population has high frequencies of the hemochromatosis gene (HFE gene) variants H63D and C282Y and clinical hemochromatosis is quite common. The objective of the study was to examine the impact of the combination of the HFE variants wildtype (wt), H63D, and C282Y on body iron status markers in a population of 2,613 apparently healthy ethnic Danish men and women.
Methods: An epidemiological population study was performed in Copenhagen County comprising a randomly selected population consisting of 1,342 men and 1,271 women. Blood samples were drawn in the morning in the fasting state for analysis of HFE genotypes and hematological iron status markers (hemoglobin, serum iron, serum transferrin, transferrin saturation, and serum ferritin).
Results: The HFE gene variants, H63D and C282Y, in any combination as well as in any combination with the HFE wt genotype, had a significant influence on iron status markers, compared with the wt/wt genotype. When arranged according to their relative frequency in the population, individuals with the six different HFE genotypes, i.e. wt/wt, H63D/wt, C282Y/wt, H63D/H63D, C282Y/H63D, and C282Y/C282Y, displayed gradually increasing levels of serum iron, decreasing levels of serum transferrin, and increasing levels of transferrin saturation in both genders. In men, ferritin increased gradually according to the HFE genotype. In women, ferritin levels were by and large independent of the HFE genotypes.
Conclusions: Using the iron status markers in HFE wt/wt individuals as a baseline, any other combination of the HFE genotypes had a significant impact on iron status. The C282Y/C282Y genotype was associated with the highest impact on iron status markers including serum ferritin and thus body iron overload. Due to physiological iron losses with menstruations and pregnancies, women are partly protected against significant body iron overload, regardless of the HFE genotype.
Keywords: Danish people; Ferritins; Hemochromatosis; HFE protein; Human; Iron; Transferrin; Transferrin saturation
| Introduction | ▴Top |
Since the discovery of the hemochromatosis (HFE) gene and its major variants or mutations, genetic HFE hemochromatosis has emerged as one of the most common genetic disorders in populations of Northern European descendance [1]. HFE hemochromatosis, which is inherited as an autosomal recessive trait [2], causes hyperabsorption of iron from the food, due to insufficient hepcidin production [3], thereby inducing a gradual increase in body iron content, which in many cases can result in a large variety of symptoms including various degrees of organ damage, e.g., to the liver, pancreas, heart, and endocrine glands [4]. The penetrance of the disorder depends on a number of both intrinsic factors, e.g., gender and age as well as on extrinsic factors, e.g., the composition of the diet and dietary iron intake, alcohol consumption [5-7], and physiological blood losses at menstruations [8] and pregnancies [9] as well as non-physiological blood losses by blood donation [9].
The purpose of the present study was to evaluate the association between the clinically most important HFE genotype combinations (wildtype (wt), C282Y, and H63D) and hematological iron status markers in a randomly selected, representative sample of apparently healthy ethnic Danish men and women. To the knowledge of the authors, a similar study has not previously been performed.
| Materials and Methods | ▴Top |
This epidemiological World Health Organization-initiated population study for the “Monitoring of Trends and Determinants in Cardiovascular Disease” (DAN-MONICA) running from November 1982 through January 1984 was approved by the local ethics committees, and all participants gave informed consent to attend the study and to the obtained blood samples. The study fulfilled the Declaration of Helsinki. The study was performed at the Center for Population Studies in Glostrup in Copenhagen County, Denmark. The selection of the participants, being residents in Copenhagen County, has been described in detail elsewhere [10, 11]. In total, 2,280 apparently healthy ethnic Danish men and 2,340 apparently healthy ethnic Danish women in equal-numbered age cohorts of 30, 40, 50, and 60 years were drawn at random from the Census Registry and invited to participate in a health survey; 1,843 men and 1,765 women responded to the invitation. In a randomly selected subgroup consisting of 1,342 men and 1,271 women, blood samples were available for analysis of DNA and hematological iron status markers.
The participants had a clinical examination and gave a medical history including blood donation activity and menopausal status. Blood samples were drawn in the fasting state between 08:00 and 11:00. Using a minimum of compression on the upper arm, puncture of an antecubital vein was performed with the person in the recumbent position. Hemoglobin was measured on Coulter-S. Serum iron was analyzed by a colorimetric assay using ferrozine as chromogen and serum transferrin by an immunochemical assay with subsequent turbidimetric measurement. Serum transferrin saturation in percent was calculated as: serum iron (µmol/L) × 100/serum transferrin (µmol/L) × 2. Serum was immediately frozen at -25 °C and serum ferritin subsequently measured en bloc by an immunoradiometric assay (Phadebas Ferritin PRIST®, Pharmacia Diagnostics, Uppsala, Sweden). The examination of and the distribution of HFE genotypes in this population has been described in detail in our previous paper [12].
Statistical analysis
Statistical analyses were performed using the Med-Calc® statistical software [13]. Both non-parametric and parametric statistics were employed. Fisher’s exact test, Mann-Whitney rank sum test, two-tailed probability, Student’s t-test for unpaired values, two-tailed probability with the Bonferroni correction of P-values for multiple comparisons were performed. Analysis of variance (ANOVA) of hematological iron status markers was performed using the parametric ANOVA F-test and the non-parametric Kruskal-Wallis test. Serum ferritin values were non-normally distributed even after logarithmic transformation. Consequently, median and interquartile range (IQR) were used. All P-values (including insignificant values) are shown in the tables for the readers to make their own evaluation.
None of the hematological iron status markers, in neither men nor women, were normally distributed according to the D’Agostino-Pearson test. However, as most papers use parametric data for the description of these variables, and for the convenience of the reader to be able to compare with other papers about iron status, we have stated the parametric data and calculated significance levels with both parametric and non-parametric tests.
| Results | ▴Top |
The median age was similar in men and women, being 40 years with a range of 30 - 60 years. Among the women, 646 stated to be premenopausal and 460 to be postmenopausal. The duration of the menopausal period was not available, but could be maximum 11 years, as the median age of the menopause in Danish women is 49 years, and the oldest participants were 60 years of age.
The distributions of HFE genotypes are shown in Table 1, not being significantly different in men and women.
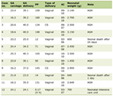 Click to view | Table 1. Distribution of HFE Genotypes in the Entire Series |
Iron status markers in the entire series are shown in Table 2. Hemoglobin and serum ferritin were measured in all participants, whereas transferrin saturation values were available in 1,816 of the 2,613 participants. All parameters, except serum transferrin, were significantly higher in men compared to women.
Click to view | Table 2. Hematological Iron Status Markers in Men and Women in the Entire Series |
Blood donation had a profound effect on iron status markers. In both genders, blood donors had slightly but significantly higher serum transferrin levels and markedly lower serum ferritin values. Blood donation was a significant confounder, and blood donors were consequently excluded from further analyses. It was noted that one of the four C282Y/C282Y homozygous men was blood donor having a serum ferritin of 386 µg/L.
HFE genotypes and iron status markers in men
The relations between HFE genotypes and iron status markers in men, non-blood donors, are shown in Tables 3 and 4 as well as in Figure 1. In order to facilitate the overview for the reader, we have chosen to show results both in tables and figures. The different HFE genotypes were numbered 1 through 6 according to their relative and decreasing frequency in the population.
Click to view | Table 3. Hematological Iron Status Markers in Men, Non-Blood Donors, According to HFE Genotypes |
Click to view | Table 4. Differences Between Iron Status Markers in Men, Non-Blood Donors, According to HFE Genotypes |
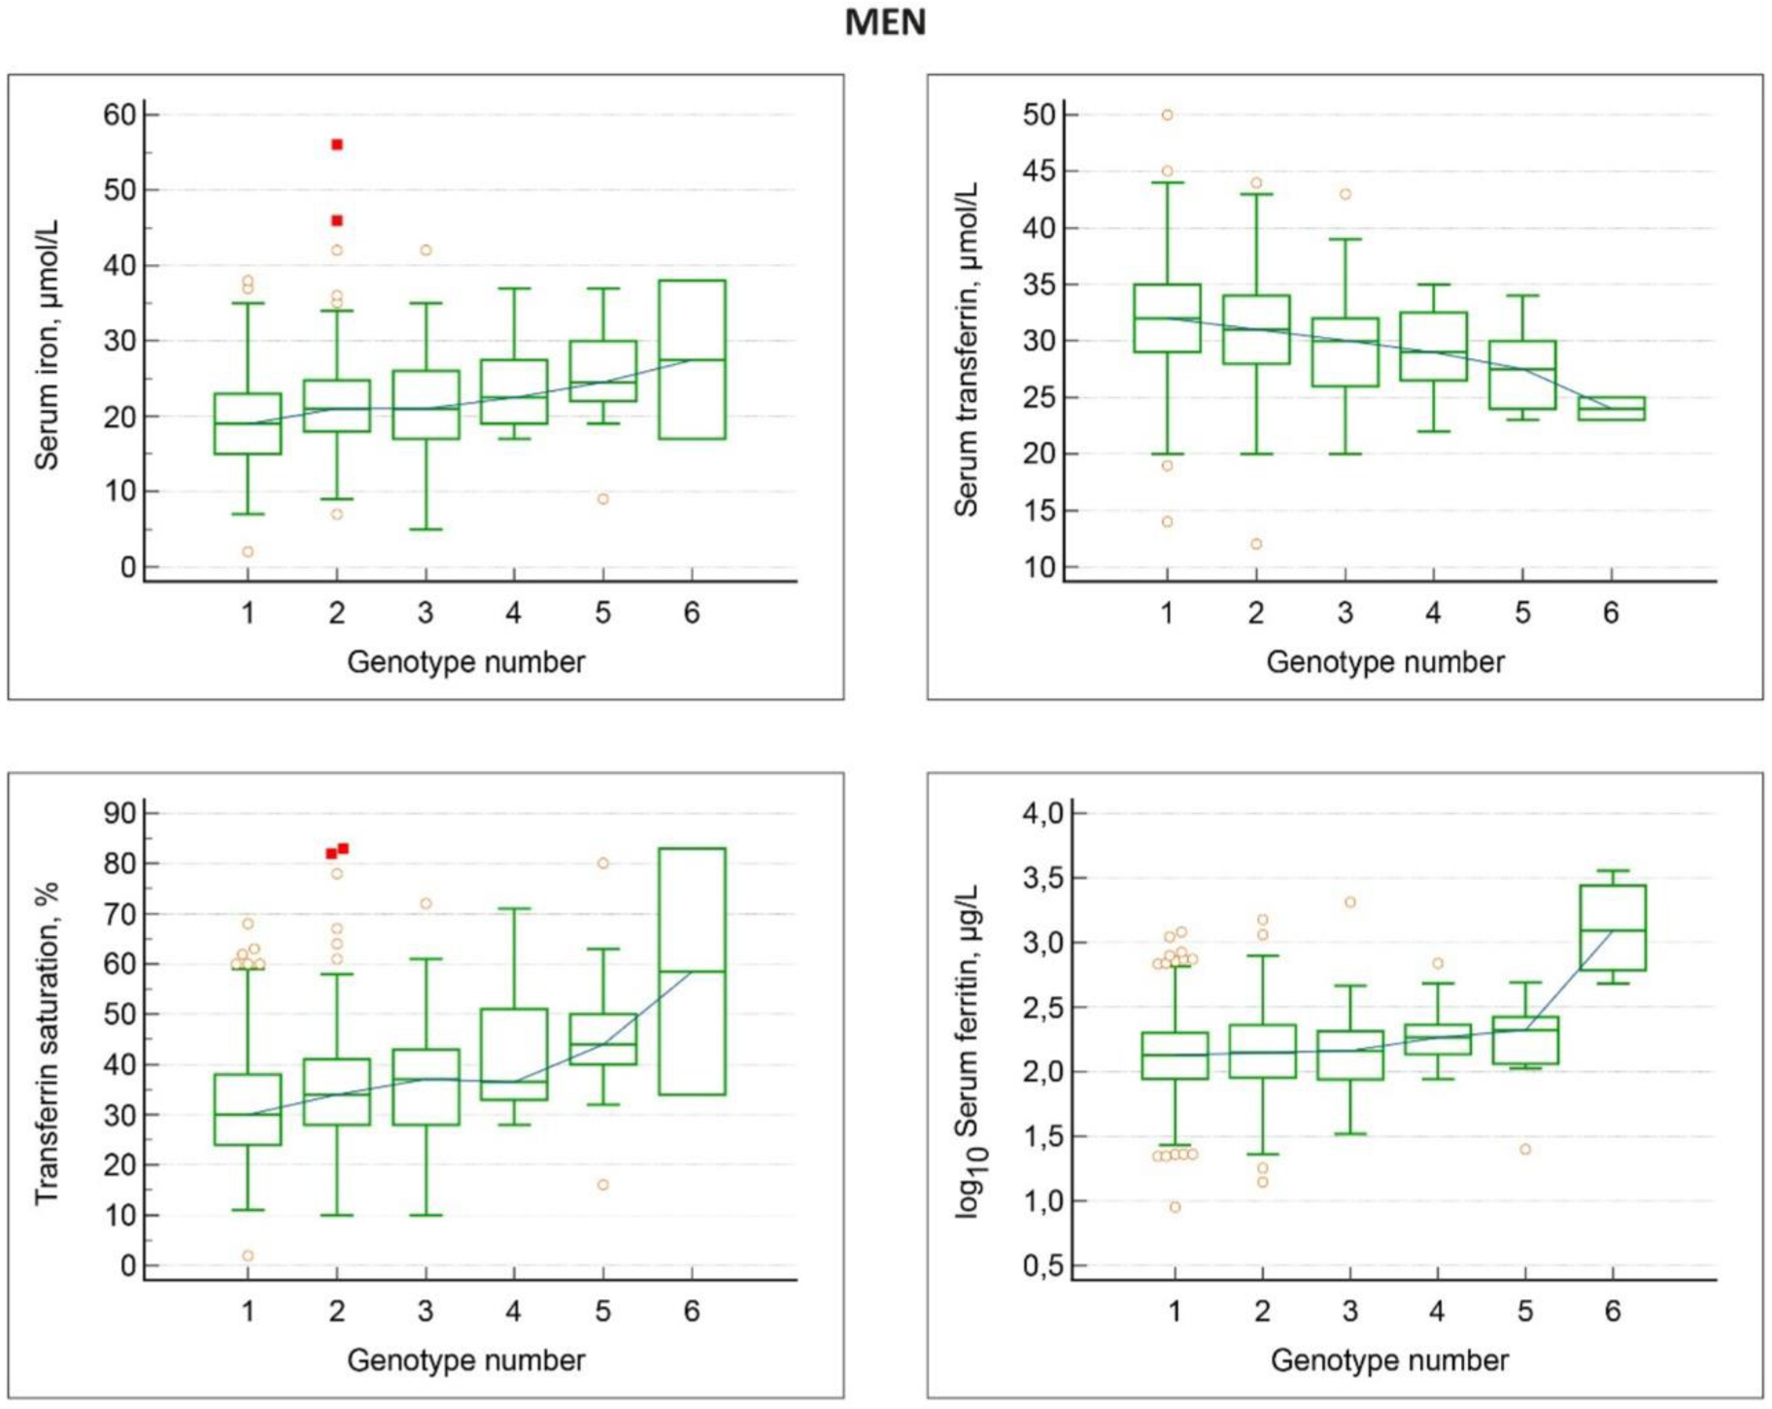 Click for large image | Figure 1. Associations between HFE genotypes and iron status markers in men, non-blood donors. Genotype numbers denote: 1 wt/wt; 2 H63D/wt; 3 C282Y/wt; 4 H63D/H63D; 5 C282Y/H63D; 6 C28Y/C282Y. With increasing genotype number, there is a gradual increase in serum iron, transferrin saturation and serum ferritin, and a gradual decrease in serum transferrin. |
Hemoglobin values were similar in all HFE genotypes. However, there was a gradual, significant increase in serum iron, a decrease in serum transferrin, an increase in transferrin saturation, and an increase in serum ferritin levels in the various HFE genotypes 1 through 6, i.e., wt/wt, H63D/wt, C282Y/wt, H63D/H63D, C282Y/H63D, and C282Y/C282Y (Table 3). The C282Y/C282Y group comprised three men, all having high serum ferritin values above 300 µg/L. In the other genotypes, the frequencies of high serum ferritin values ranged from 9% to 14% and were not significantly different compared with the wt/wt genotype (Fisher’s exact test: P-values ≥ 0.1).
The significances of differences between iron status markers in men, according to HFE genotypes, are shown in Table 4. The wt/wt genotype men had significantly lower serum iron levels, higher serum transferrin levels (although not consistently significant), and lower transferrin saturation levels compared to all the other genotypes. Concerning serum ferritin levels, there were no significant differences between the wt/wt genotype compared to the other genotypes, except for the H63D/H63D and C282Y/C282Y groups, who had significantly higher serum ferritin levels compared to the wt/wt group.
The distribution of high transferrin saturation values in the different HFE genotypes is shown in Table 5. In the series of men having transferrin saturation measured, 52/652 (8.0%) men had high saturation > 50% and of these 12/52 men (23.1%) had high serum ferritin > 300 µg/L. There was a clear and significant trend that the frequency of high values increased steadily from wt/wt, through H63D/H63D to C282Y/H63D and C282Y/C282Y. In fact, the first four non-wt/wt genotypes, number 2 through 5, had a significantly higher frequency of transferrin saturation levels above 50% than the wt/wt group (Fisher’s exact test: P = 0.02 to 0.03).
Click to view | Table 5. Frequencies of High Transferrin Saturation Values in Various HFE Genotype Groups and Their Relationship With High Serum Ferritin Values in Men and Women, Non-Blood Donors |
When comparing the frequency of high serum ferritin values in men with high transferrin saturation values, we found no association between the presence of high transferrin saturation values and the frequency of high serum ferritin values (Fisher’s exact test: P = 0.7) (Table 5). Also, there was no association between HFE genotypes and the occurrence of iron deficiency, i.e., ferritin values < 15 or < 30 µg/L (data not shown).
HFE genotypes and iron status markers in women
Among the women, 646 were premenopausal and 460 postmenopausal. Postmenopausal women had significantly higher median serum ferritin 73 µg/L (IQR: 45 - 121) than premenopausal women, median 38 µg/L (IQR: 22 - 67) (Mann-Whitney test for unpaired values, two-tailed probability: P < 0.0001). There were no significant differences in hemoglobin, serum iron, serum transferrin or transferrin saturation values between pre- and postmenopausal women.
The relations between HFE genotypes and iron status markers in women, non-blood donors, are shown in Tables 6 and 7 as well as in Figure 2.
Click to view | Table 6. Hematological Iron Status Markers in Women, Non-Blood Donors, According to HFE Genotypes |
Click to view | Table 7. Differences Between Iron Status Markers in Women, Non-Blood Donors, According to HFE Genotypes |
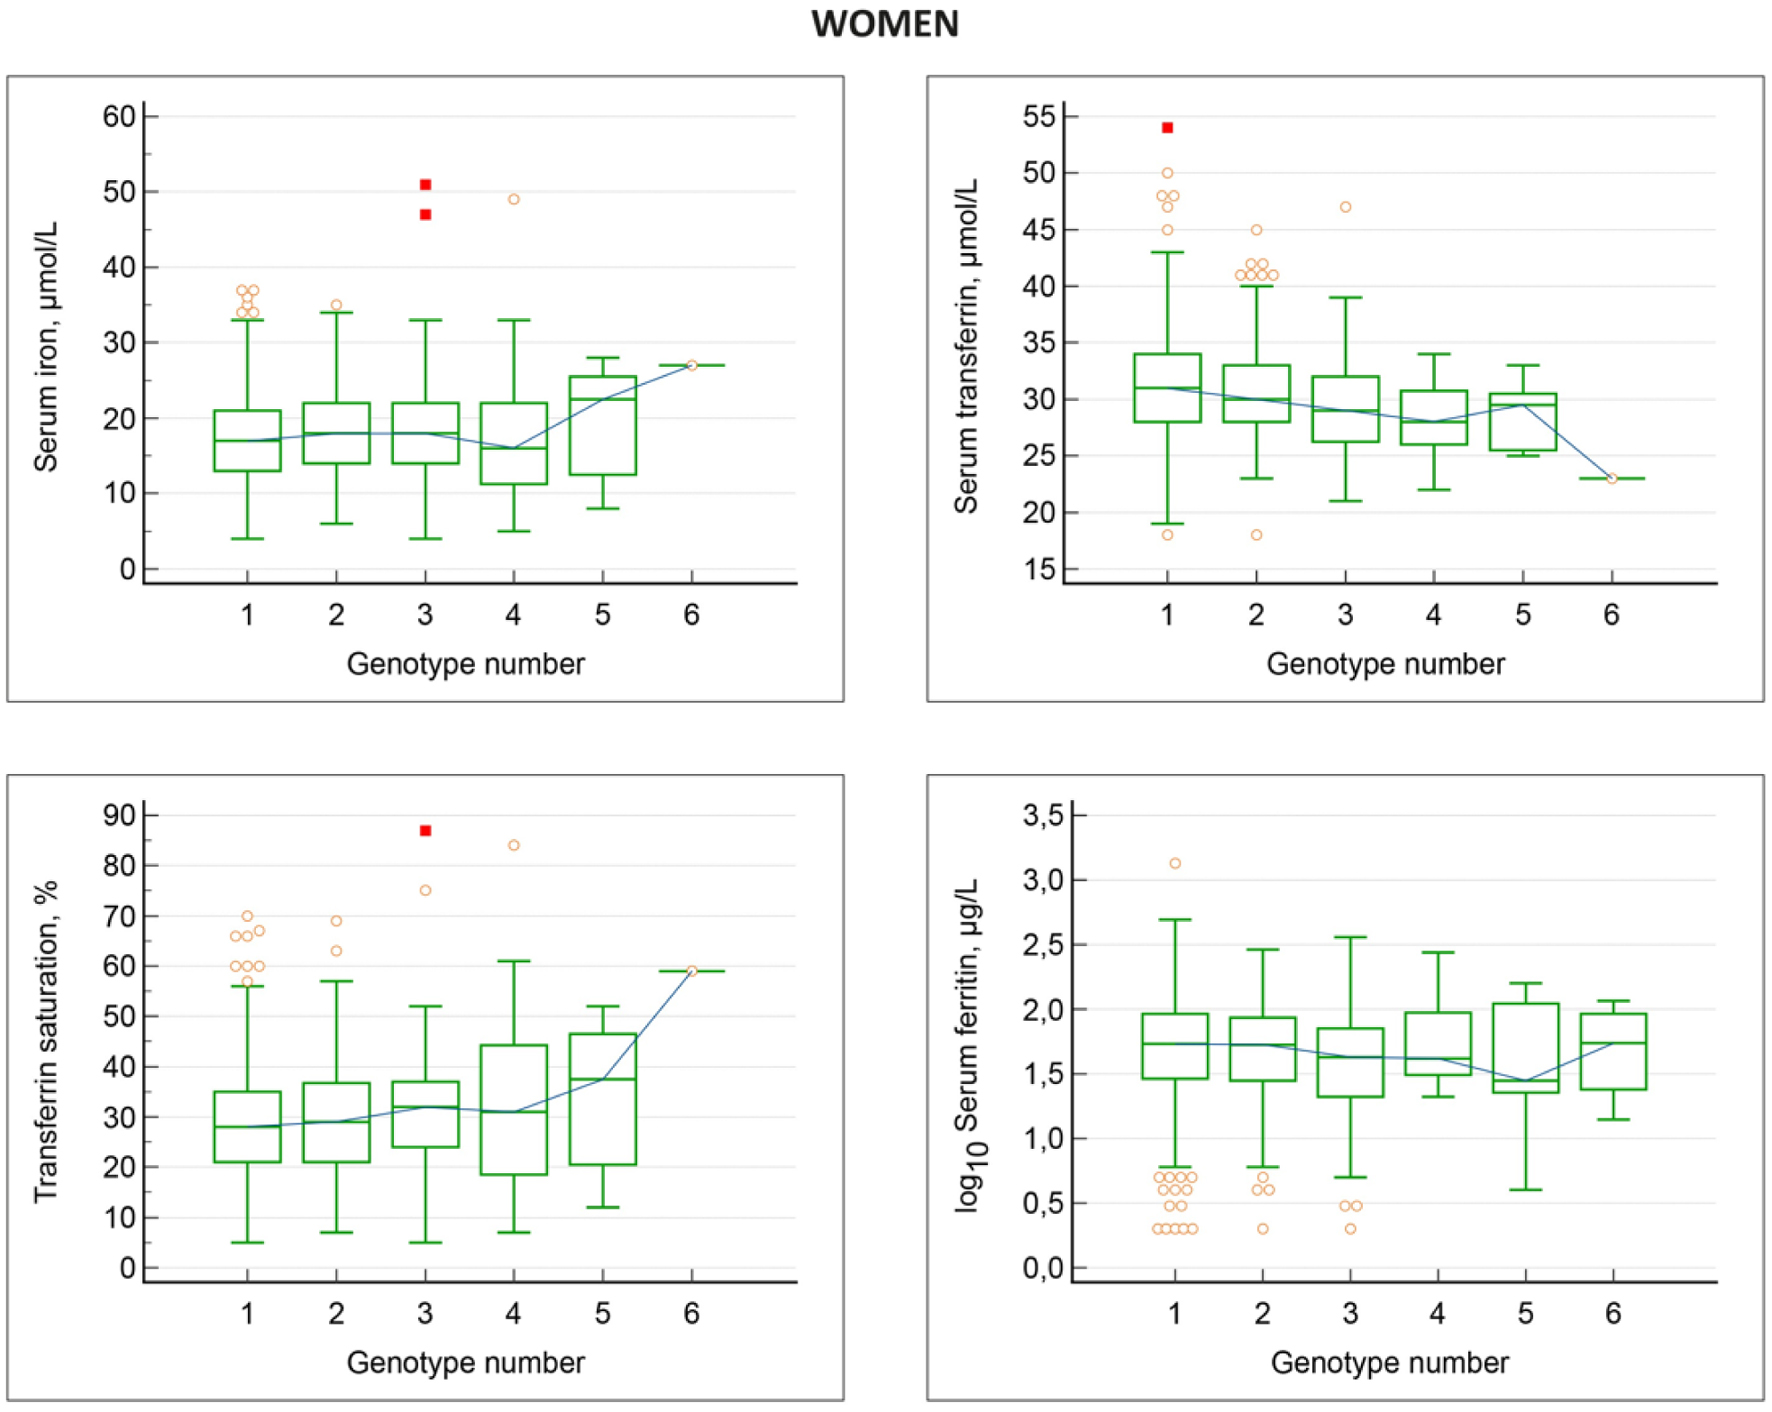 Click for large image | Figure 2. Associations between HFE genotypes and iron status markers in women, non-blood donors. Genotype numbers denote: 1 wt/wt; 2 H63D/wt; 3 C282Y/wt; 4 H63D/H63D; 5 C282Y/H63D; 6 C28Y/C282Y. With increasing genotype number, there is a gradual decrease in serum transferrin and increase in transferrin saturation. Serum iron is elevated only in the C282Y/H63D and C28Y/C282Y genotypes, while serum ferritin is by and large similar in all genotypes. |
Overall, women displayed the same pattern of changes in iron status markers in the different HFE genotypes as seen in men with some exceptions. Hemoglobin values were similar in the various HFE genotypes. Serum iron displayed a slight, gradual increase, which however, was not statistically significant. There was a gradual, significant decrease in serum transferrin, and a gradual significant increase in transferrin saturation with increasing HFE genotype number. In contrast to the findings in men, serum ferritin levels were not significantly different in the various HFE genotypes. The C282Y/C282Y group comprised four women, all being premenopausal, and having relatively low serum ferritin values ranging from 14 to 116 µg/L. The frequencies of high serum ferritin values > 200 µg/L in the different genotypes ranged from 0% to 21% and were not significantly different in the various HFE genotype groups including the wt/wt group (Fisher’s exact test: P-values ≥ 0.5).
The distribution of high transferrin saturation values in different HFE genotypes are shown in Table 5. In the series of women having transferrin saturation measured, 63/795 women (7.9%) had high saturation > 45%, and of these 2/63 (3.2%) had high serum ferritin > 200 µg/L. There was a trend that the frequency of high saturation values increased from the wt/wt genotype, through the remaining HFE genotypes, but none of the five non-wt/wt genotypes displayed a significantly higher frequency of saturation levels above 45% than the wt/wt group (Fisher’s exact test: P = 0.3). Also, the entire non-wt/wt group did not have significantly higher frequency of high saturation values compared to the wt/wt group (Fisher’s exact test: P = 0.2).
Like in men, we found no association between the presence of high transferrin saturation values > 45% and the frequency of high serum ferritin values > 200 µg/L in women (Fisher’s exact test: P = 0.7) (Table 5). Likewise, women displayed no association between HFE genotypes and the occurrence of iron deficiency, i.e., ferritin values < 15 or < 30 µg/L (data not shown).
| Discussion | ▴Top |
Overall, there was no relationship between HFE genotypes and hemoglobin levels, neither in men nor women. In men, there were significant associations between the various HFE genotypes and iron status markers. Interestingly, individuals with the wt/wt genotype had significantly lower serum iron, higher serum transferrin, and lower transferrin saturation than individuals with the other five HFE genotypes (Tables 3 and 4). There was also a tendency that the wt/wt genotype had lower ferritin, compared with the other five genotypes, but the differences were only significant in comparison with the H63D/H63D and C282Y/C282Y genotypes (Table 4). Elevated ferritin levels were predominantly associated with the H63D/H63D, C282Y/H63D, and C282Y/C282Y genotypes. The frequencies of high ferritin levels > 300 µg/L were not significantly different between the various HFE genotypes, except for individuals with the C282Y/C282Y genotype, all having levels above 480 µg/L. Overall, the results show that any HFE variant actually has a significant impact on iron status markers, which is dependent on the specific genotype, and the most profound impact was associated with the C282Y/C282Y genotype. The association between HFE genotypes and iron status markers is likewise reinforced by the significant relationship between genotypes and the increasing frequency of high transferrin saturation values > 50% from the wt/wt genotype to the C282Y/C282Y genotype (Table 5). Interestingly, there was no association between the occurrence of high saturation values > 50% and high ferritin values > 300 µg/L (Table 5), indicating that other extrinsic and/or intrinsic factors than HFE genotype interfere in the regulation of body iron stores.
By and large, women displayed the same associations between HFE genotypes and iron status markers as men, but the associations were less pronounced. The wt/wt genotype female individuals had lower (although not significantly) serum iron, higher serum transferrin, and lower transferrin saturation than all the other five HFE genotypes (Tables 6 and 7). However, we found no association between HFE genotypes and serum ferritin levels, not even in the four C282Y/C282Y premenopausal women, who all had ferritin values < 200 µg/L. According to the findings in men, we observed an increasing frequency of high transferrin saturation values above 45% (Table 5) in the various six HFE genotypes but no association between the occurrence of high saturation values and high ferritin values > 200 µg/L.
Clearly, the impact of the various HFE genotypes on ferritin levels in women was less pronounced than in men. Probably, individually variable blood- and iron losses associated with menstruations and pregnancies [9] will prevent body iron accumulation and blur a potential relationship between HFE genotypes and ferritin levels in premenopausal women. In women, ferritin levels remain low and fairly stable from the menarche until the menopause [9]. However, after the menopause, which occurs at a median age of 49 years, ferritin levels gradually increase, especially during the first 6 - 7 postmenopausal years, and reach a plateau after approximately 10 years [8], consequently, in women, clinically overt hemochromatosis is predominantly diagnosed some years after the menopause. In this series, the number of postmenopausal women was not sufficient to allow a separate analysis of HFE genotype versus iron status, because the duration of the menopause was not available.
It is somewhat surprising that in both genders, the observed increase in serum iron with increasing HFE genotype number was not counterbalanced by an increase in serum transferrin, which speculatively could be expected in order to retain a low level of transferrin saturation. On the contrary, the increase in serum iron was accompanied by a concomitant decrease in serum transferrin, thereby inducing a further increase in transferrin saturation. An elevated transferrin saturation above 50-60% is considered an important factor for iron accumulation in the various organs in HFE hemochromatosis due to the concomitant existence of non-transferrin bound iron [14]. Likewise, in the general population, elevated transferrin saturation levels appear to be associated with a higher mortality rate [15, 16].
Nutritional factors also contribute to the differences between men and women. Danish men have a significantly higher total dietary iron intake as well as a higher intake of meat and alcohol than women [17], factors which will significantly influence body iron status.
We have so far assumed that the major metabolic effects of the HFE variants are exerted through their impact on iron metabolism and being associated with the magnitude of body iron accumulation. However, recent studies have shown that the HFE variants by themselves, especially the C282Y variant, predispose to certain disorders/diseases independently of body iron status [18, 19]. In a large population study [18], C282Y homozygotes had an increased risk of infections and death from infections. Even C282Y homozygotes with normal iron status markers had an increased infection risk.
Another population study [19] showed that C282Y homozygotes with normal iron status markers had an increased risk of diabetes. Also, C282Y homozygotes with diabetes had higher mortality than HFE-non-carriers with diabetes. It is therefore possible that future research may reveal other, yet undiscovered metabolic effects of the HFE variants which work independently of body iron status.
Conclusions
This epidemiological population study of apparently healthy ethnic Danish men and women shows that the two clinically most important HFE gene variants, H63D and C282Y, in any combination as well as in any combination with the HFE-wt/wt genotype, exert a significant influence on iron status markers, serum iron, serum transferrin, serum transferrin saturation, and serum ferritin, when using the iron status markers in wt/wt individuals as a baseline. When arranged according to their relative frequency in the population, individuals with the six different HFE genotypes wt/wt, H63D/wt, C282Y/wt, H63D/H63D, C282Y/H63D, and C282Y/C282Y displayed gradually increasing levels of serum iron, decreasing levels of serum transferrin, and increasing levels of serum transferrin saturation in both men and women. However, changes in serum ferritin displayed clear gender differences. In men, ferritin increased gradually according to the six HFE genotypes and the C282Y/C282Y genotype was associated with the highest ferritin levels and body iron overload. In premenopausal women, ferritin was by and large independent of the HFE genotype, probably due to the physiological iron losses with menstruations and pregnancies, protecting against significant body iron overload. In short, apart from the C282Y/C282Y genotype, none of the other HFE genotypes seem to be able to determine significant increases in ferritin and therefore in body iron deposits, indicating that they play only a marginal role in the development of a hemochromatosis phenotype.
Acknowledgments
The author thanks Palle Lyngsie Pedersen, MSc, PhD, Region Zealand Biobank, Naestved Hospital, Naestved, Denmark, for analyses of HFE genotypes.
Financial Disclosure
The study was supported by The Health Insurance Foundation (grant H 11-23-89), The Danish Hospital Foundation for Medical Research, Region of Copenhagen, The Faroe Islands and Greenland (grant 46-83), The Research Foundation of the Danish Voluntary Blood Donors, and the Danish Health Authority. The Danish Hemochromatosis Association (https://haemokromatose.dk/) kindly provided for the article publication charge. The funding sources were not involved in the study design, data collection, analysis and interpretation, manuscript writing, or the decision to submit the article for publication.
Conflict of Interest
The author declares to have no conflict of interest.
Informed Consent
All participants presented informed consent to participate in the study.
Author Contributions
NTM provided blood samples and the analyses of hematologic iron status markers from the population study. Statistical analyses were performed by NTM and the manuscript was written by NTM.
Data Availability
The data supporting the findings of this study are available from the corresponding author upon reasonable request.
| References | ▴Top |
- Milman N, Pedersen P. Evidence that the Cys282Tyr mutation of the HFE gene originated from a population in Southern Scandinavia and spread with the Vikings. Clin Genet. 2003;64(1):36-47.
doi pubmed - Milman N. Inheritance of hemochromatosis: family studies. In: Barton JC, Edwards CQ (eds). Hemochromatosis: genetics, pathophysiology, diagnosis and treatment. Cambridge University, Cambridge, UK 2000; p. 15-41.
- Nemeth E, Ganz T. Hepcidin and iron in health and disease. Annu Rev Med. 2023;74:261-277.
doi pubmed - Milman NT, Schioedt FV, Junker AE, Magnussen K. Diagnosis and treatment of genetic HFE-hemochromatosis: the Danish aspect. Gastroenterology Res. 2019;12(5):221-232.
doi pubmed - Pedersen P, Milman N. Genetic screening for HFE hemochromatosis in 6,020 Danish men: penetrance of C282Y, H63D, and S65C variants. Ann Hematol. 2009;88(8):775-784.
doi pubmed - Pedersen P, Milman N. Extrinsic factors modifying expressivity of the HFE variant C282Y, H63D, S65C phenotypes in 1,294 Danish men. Ann Hematol. 2009;88(10):957-965.
doi pubmed - Milman NT. Managing Genetic Hemochromatosis: An Overview of Dietary Measures, Which May Reduce Intestinal Iron Absorption in Persons With Iron Overload. Gastroenterology Res. 2021;14(2):66-80.
doi pubmed - Milman N, Kirchhoff M, Jorgensen T. Iron status markers, serum ferritin and hemoglobin in 1359 Danish women in relation to menstruation, hormonal contraception, parity, and postmenopausal hormone treatment. Ann Hematol. 1992;65(2):96-102.
doi pubmed - Milman N. Serum ferritin in Danes: studies of iron status from infancy to old age, during blood donation and pregnancy. Int J Hematol. 1996;63(2):103-135.
doi pubmed - Milman N, Kirchhoff M. Iron stores in 1433, 30- to 60-year-old Danish males. Evaluation by serum ferritin and haemoglobin. Scand J Clin Lab Invest. 1991;51(7):635-641.
doi pubmed - Milman N, Kirchhoff M. Iron stores in 1359, 30- to 60-year-old Danish women: evaluation by serum ferritin and hemoglobin. Ann Hematol. 1992;64(1):22-27.
doi pubmed - Milman N, Pedersen P, Ovesen L, Melsen GV, Fenger K. Frequency of the C282Y and H63D mutations of the hemochromatosis gene (HFE) in 2501 ethnic Danes. Ann Hematol. 2004;83(10):654-657.
doi pubmed - MedCalc statistical software version 22.032 for Windows. MedCalc Ltd., Ostend, Belgium.
- Ryan E, Mulready K, Wiegerinck E, Russell J, Swinkels DW, Stewart S. NTBI levels in C282Y homozygotes after therapeutic phlebotomy. EJHaem. 2022;3(3):644-652.
doi pubmed - Mainous AG, 3rd, Gill JM, Carek PJ. Elevated serum transferrin saturation and mortality. Ann Fam Med. 2004;2(2):133-138.
doi pubmed - Ellervik C, Tybjaerg-Hansen A, Nordestgaard BG. Total mortality by transferrin saturation levels: two general population studies and a metaanalysis. Clin Chem. 2011;57(3):459-466.
doi pubmed - Milman NT. A review of nutrients and compounds, which promote or inhibit intestinal iron absorption: making a platform for dietary measures that can reduce iron uptake in patients with genetic haemochromatosis. J Nutr Metab. 2020;2020:7373498.
doi pubmed - Mottelson M, Glenthoj A, Nordestgaard BG, Ellervik C, Petersen J, Bojesen SE, Helby J. Iron, hemochromatosis genotypes, and risk of infections: a cohort study of 142 188 general population individuals. Blood. 2024;144(7):693-707.
doi pubmed - Mottelson M, Helby J, Nordestgaard BG, Ellervik C, Mandrup-Poulsen T, Petersen J, Bojesen SE, et al. Mortality and risk of diabetes, liver disease, and heart disease in individuals with haemochromatosis HFE C282Y homozygosity and normal concentrations of iron, transferrin saturation, or ferritin: prospective cohort study. BMJ. 2024;387:e079147.
doi pubmed
This article is distributed under the terms of the Creative Commons Attribution Non-Commercial 4.0 International License, which permits unrestricted non-commercial use, distribution, and reproduction in any medium, provided the original work is properly cited.
Gastroenterology Research is published by Elmer Press Inc.