| Gastroenterology Research, ISSN 1918-2805 print, 1918-2813 online, Open Access |
| Article copyright, the authors; Journal compilation copyright, Gastroenterol Res and Elmer Press Inc |
| Journal website https://gr.elmerpub.com |
Original Article
Volume 18, Number 6, December 2025, pages 276-285

HFE-C282Y/C282Y Hemochromatosis Patients Have Lower Serum Transferrin and Strong Negative Correlations Between Iron, Ferritin, and Transferrin Saturation Versus Transferrin Compared With HFE-wt/wt Wild-Type Subjects
Nils Thorm Milman ![]()
Department of Clinical Biochemistry, Naestved Hospital, University of Zealand, DK-4700 Naestved, Denmark
Manuscript submitted October 15, 2025, accepted November 22, 2025, published online December 20, 2025
Short title: HFE-Hemochromatosis: Correlations Between Iron Status Markers
doi: https://doi.org/10.14740/gr2100
| Abstract | ▴Top |
Background: HFE-C282Y/C282Y hemochromatosis patients have lower serum transferrin levels than normal individuals, but the reason for this discrepancy has drawn little scientific attention and remains unclarified. The objective of this study was to examine transferrin levels and their correlations with other biochemical iron status markers in Danish patients with the C282Y/C282Y variant and compare with corresponding correlations in a population of healthy Danes with the HFE-wt/wt genotype.
Methods: The study comprised 21 patients (11 men) who completed a questionnaire about age, number of years with hemochromatosis, and at least 10 consecutive blood sample results, including ferritin, iron, transferrin and transferrin saturation (TSAT). The control group consisted of 958 persons (441 men).
Results: The findings were comparable in both genders: 1) All but one patient had significantly lower transferrin levels than controls; 2) Serum iron and ferritin showed negative correlations with transferrin; 3) TSAT displayed strong negative correlations with transferrin; 4) Positive correlations were present between iron and ferritin, iron and TSAT, and ferritin and TSAT.
Conclusions: Hemochromatosis patients had lower transferrin levels than controls, contributing to a higher TSAT; the explanation for this remains unsolved. Patients displayed negative correlations between iron and ferritin vs. transferrin, as well as negative correlations between TSAT and transferrin, suggesting that high TSAT levels may accelerate the degradation of transferrin. In HFE-patients, transferrin metabolism is not clarified, and the potential influence of the C282Y/C282Y variant is unknown. Contrary to “normal” metabolism, which is primarily regulated by iron levels, many patients maintain low transferrin and high TSAT even after iron depletion. It would be valuable to explore whether this decrease in transferrin reflects reduced hepatic synthesis or increased degradation. There is a need for further investigation of this important dilemma in HFE-hemochromatosis.
Keywords: Ethnic Danes; Ferritins; Hemochromatosis; HFE protein; Human; Iron; Transferrin; Transferrin saturation
| Introduction | ▴Top |
HFE-hemochromatosis is characterized by increased serum iron, elevated serum ferritin and increased body iron stores [1]. Concomitantly, the serum total iron binding capacity (TIBC) decreases, which is supposed in part to explain the high serum transferrin saturation (TSAT) in these patients [2]. There seem to have been no serious attempts to explain this controversial finding. From a teleological point of view, it would be more logical if an increased body iron burden would initiate a stimulus for an increased transferrin production, in order to protect the organism from the toxic potential of free iron radicals in the form of non-transferrin-bound iron (NTBI) and labile iron [3].
Most English-speaking countries use the concepts of TIBC and unsaturated iron binding capacity (UIBC) [2]. In Denmark, there is a long-standing tradition in clinical biochemistry to measure the serum/plasma transferrin concentration per se when examining body iron status. The earliest transferrin assays in Denmark used rocket electrophoresis, developed in the late 1960s by Laurell, and later, several different immunoassays were introduced.
In our previous paper from 1991 [4], 5 years before the discovery of the HFE gene, we found that subjects with clinical and preclinical hemochromatosis (based on human leukocyte antigen (HLA) typing) had significantly lower serum transferrin than heterozygous and normal individuals. Likewise, in a recent epidemiological study of a healthy ethnic Danish population, we demonstrated that subjects carrying HFE variants C282Y and/or H63D in any combination had significantly increased serum iron and serum ferritin concentrations, and TSAT levels, accompanied by a significant decrease in serum transferrin levels, compared to healthy HFE-wt/wt control subjects [5]. These findings inspired us to perform this study in a group of patients with C828Y/C282Y hemochromatosis to further validate our previous results.
| Materials and Methods | ▴Top |
We conducted an anonymous electronic online survey among the members of The Danish Hemochromatosis Association [6] with HFE-C282Y/C282Y hemochromatosis in June 2025 using the platform “SurveyPlanet®.” Twenty-one ethnic Danes responded to the invitation and filled in a questionnaire containing information about gender, age, number of years with diagnosed hemochromatosis, and the results of at least 10 consecutive blood samples including hemoglobin, serum iron, serum transferrin, TSAT, and serum ferritin. All patients were followed regularly at the regional hemochromatosis clinics in Denmark and treated with phlebotomy when needed. Control blood samples were taken prior to phlebotomy, and the results were registered in “Min Sundhedsplatform” (“My Health Platform”), where Danish citizens can access their laboratory results electronically. In the following, the prefix “serum” will be omitted from the text for more smooth reading.
The patients were treated at outpatient clinics all over Denmark, and the biochemical analyses were performed in different clinical biochemical laboratories using slightly different analysis methods. As a result, we could not pool the analyses in the statistical calculations but had to analyze each patient individually.
The control group was randomly chosen from the World Health Organization-initiated epidemiological study for the “Monitoring of Trends and Determinants in Cardiovascular Disease” (DAN-MONICA), conducted from November 1982 through January 1984. The study was approved by the local ethics committees, and all participants gave informed consent for participation and blood sample collection. The study adhered to the Declaration of Helsinki.
The study was performed at the Center for Population Studies in Glostrup in Copenhagen County, Denmark. The selection of the participants, all residents in Copenhagen County, has been described in detail elsewhere [5, 7, 8]. In total, 2,280 apparently healthy ethnic Danish men and 2,340 apparently healthy ethnic Danish women in equal-numbered age cohorts of 30, 40, 50, and 60 years were drawn at random from the Census Registry and invited to participate in a health survey; 1,843 men and 1,765 women responded to the invitation. In a randomly selected subgroup consisting of 1,342 men and 1,271 women, blood samples were available for analysis of DNA and hematological iron status markers.
The control group had a clinical examination and gave a medical history including blood donation activity. Blood samples were drawn once during 1982 - 1984 in the fasting state between 8:00 am and 11:00 am. Using a minimum of compression on the upper arm, puncture of an antecubital vein was performed with the person in the recumbent position. Hemoglobin was measured on Coulter-S. Iron was analyzed by a colorimetric assay using ferrozine as chromogen, and transferrin by an immunochemical assay with subsequent turbidimetric measurement. TSAT in percent was calculated as: iron (µmol/L) × 100/transferrin (µmol/L) × 2. Serum was immediately frozen at -25 °C, and ferritin subsequently measured en bloc by an immunoradiometric assay (Phadebas Ferritin PRIST®, Pharmacia Diagnostics, Uppsala, Sweden). The examination of and the distribution of HFE genotypes in this population has been described in detail in our previous paper [5].
Statistics
Statistical analyses were performed using the MedCalc® Statistical Software version 23.3.7 [9]. As ferritin values were non-normally distributed, even after logarithmic transformation, correlations were calculated using Spearman’s rank correlation coefficient rho (rs) for non-normally distributed values, of which the results are given in this paper. In addition, we calculated correlations using Pearson’s correlation coefficient r for normally distributed values, and they were either identical to or very close to the values obtained by using Spearman’s rs. Comparison of correlation coefficients in the control group and between patients and controls was performed by a previously described method [10].
| Results | ▴Top |
Correlations between iron status markers in non-blood-donors with the HFE-wt/wt genotype
For more easy understanding, we start by describing the findings in the healthy control group. Among the HFE-genotyped individuals, only those having HFE-genotype wt/wt were included as controls. Subsequently, blood donors were excluded as blood donation profoundly influenced body iron status [4]. Each control participant had one measurement of iron status markers, so the calculated correlations were based on cross-sectional analyses.
Table 1 shows the correlations between iron status markers. In men, there was a weak correlation between the iron and ferritin concentrations. Neither iron nor ferritin were correlated with transferrin concentrations, while there was a very high correlation between iron and TSAT and a lower, but still significant correlation between ferritin and TSAT. Notably, there were slight negative correlations between transferrin and TSAT.
 Click to view | Table 1. Correlations Between Serum Iron Status Markers in Apparently Healthy Adults With HFE-wt/wt Genotype |
Men having ferritin >300 µg/L, i.e., presumed ample iron reserves or “iron overload”, had slightly, but significantly, lower transferrin than men with ferritin 30 - 300 µg/L, i.e., “normal” iron status. Only four men had ferritin < 30 µg/L.
In women, there was no correlation between the iron and ferritin concentrations. Neither iron nor ferritin were correlated with transferrin concentrations, while there was a very high correlation between iron and TSAT. Women with “normal” iron status displayed no correlation between ferritin and TSAT, while this was present in women with low iron status. As in men, there were negative correlations between transferrin and TSAT, especially in women with low ferritin.
Women having “normal” iron status had significantly lower transferrin than men with “normal” iron status. Women with low iron status had significantly higher transferrin than those with “normal” iron status. Only six women had ferritin > 300 µg/L.
Correlations between iron status markers in the C282Y/C282Y genotype
Twenty-one persons (11 men) fulfilled the questionnaire and were included. Men had a median age of 69 years (range 44 - 73), had hemochromatosis for median 10 years (range 1 - 19), and had a median number of consecutive blood samples of 24 (range 11 - 39).
Women had a median age of 57 years (range 48 - 77 years), had hemochromatosis for median 9 years (range 1 - 34), and had a median number of consecutive blood samples of 22 (range 10 - 38). All men had hemoglobin values > 130 g/L and all women values > 120 g/L prior to phlebotomies. Hemoglobin values showed no correlation with iron status markers (data not shown).
Correlations between iron status markers were calculated separately for each patient using the consecutive laboratory results.
As an example, the correlations between iron, ferritin, TSAT and transferrin are shown in detail in graphs in three patients (Figs. 1-3). The patients were chosen for their high number of consecutive blood samples and for illustrative purposes.
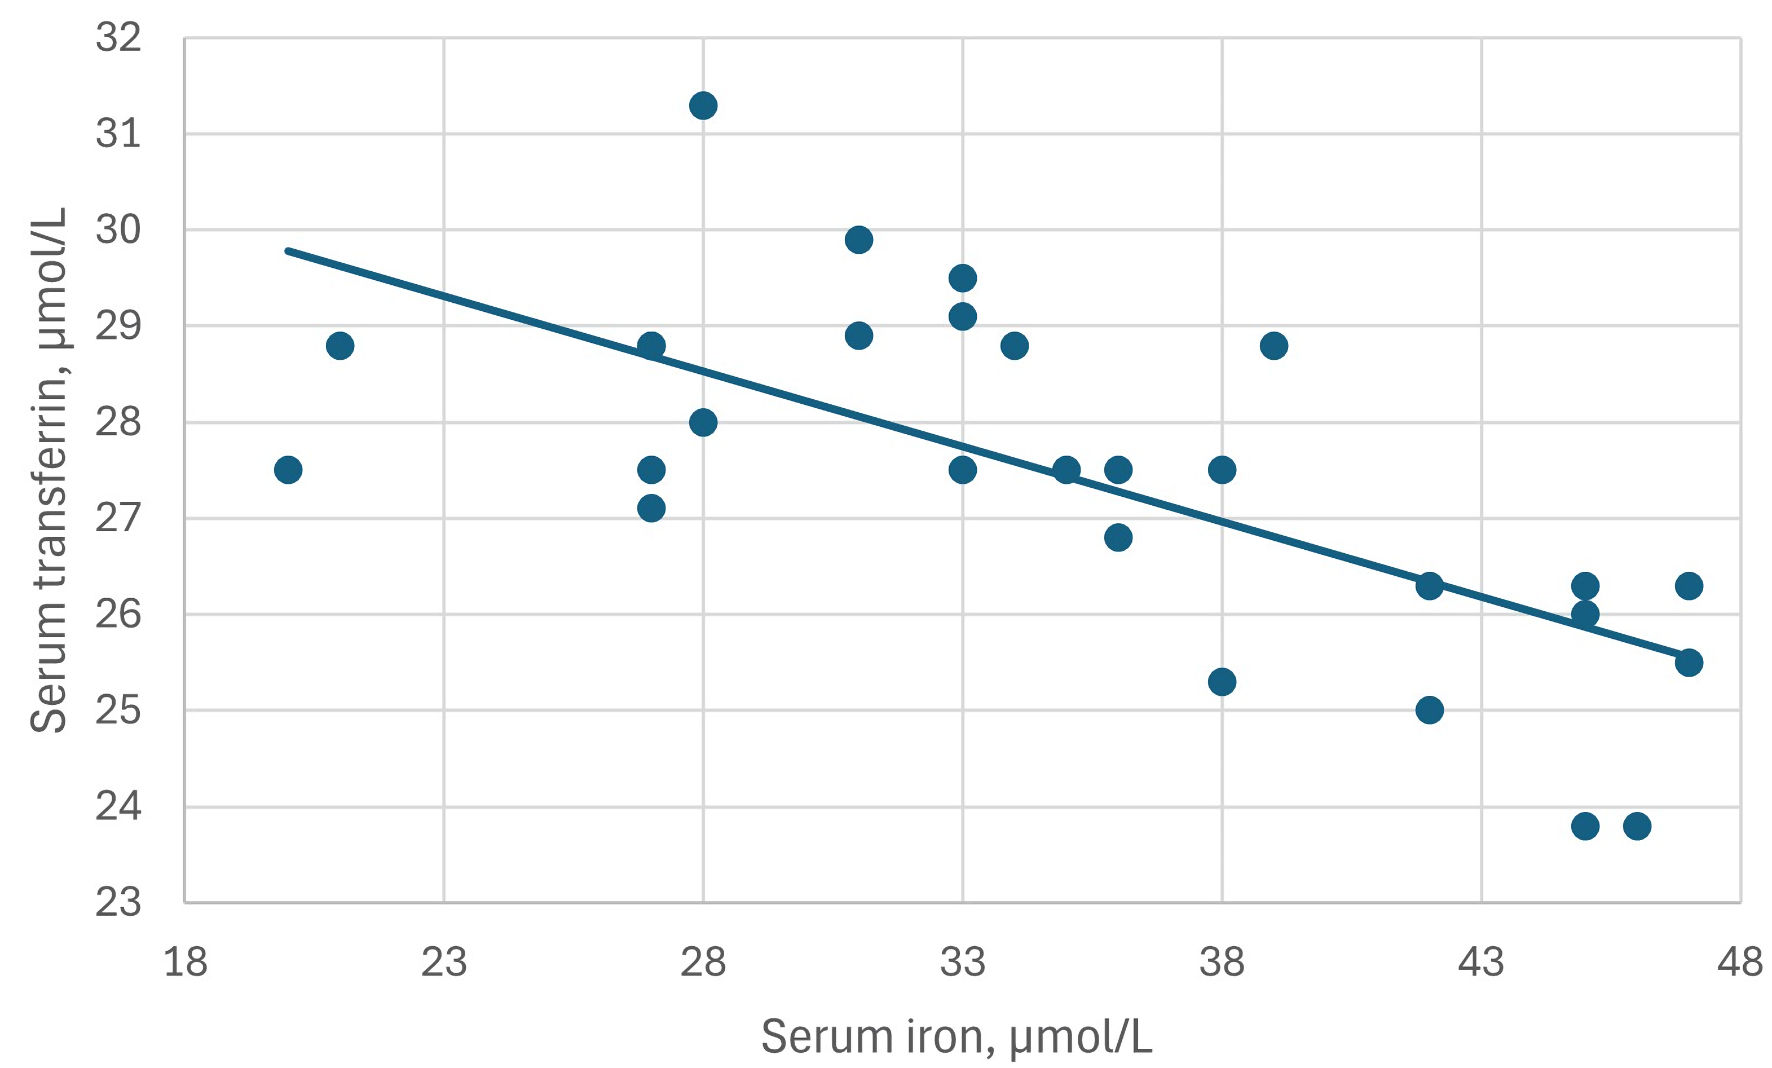 Click for large image | Figure 1. The inverse correlation between serum iron and serum transferrin levels in patient M10. Correlation coefficient rs = -0.68, P = 0.0001. |
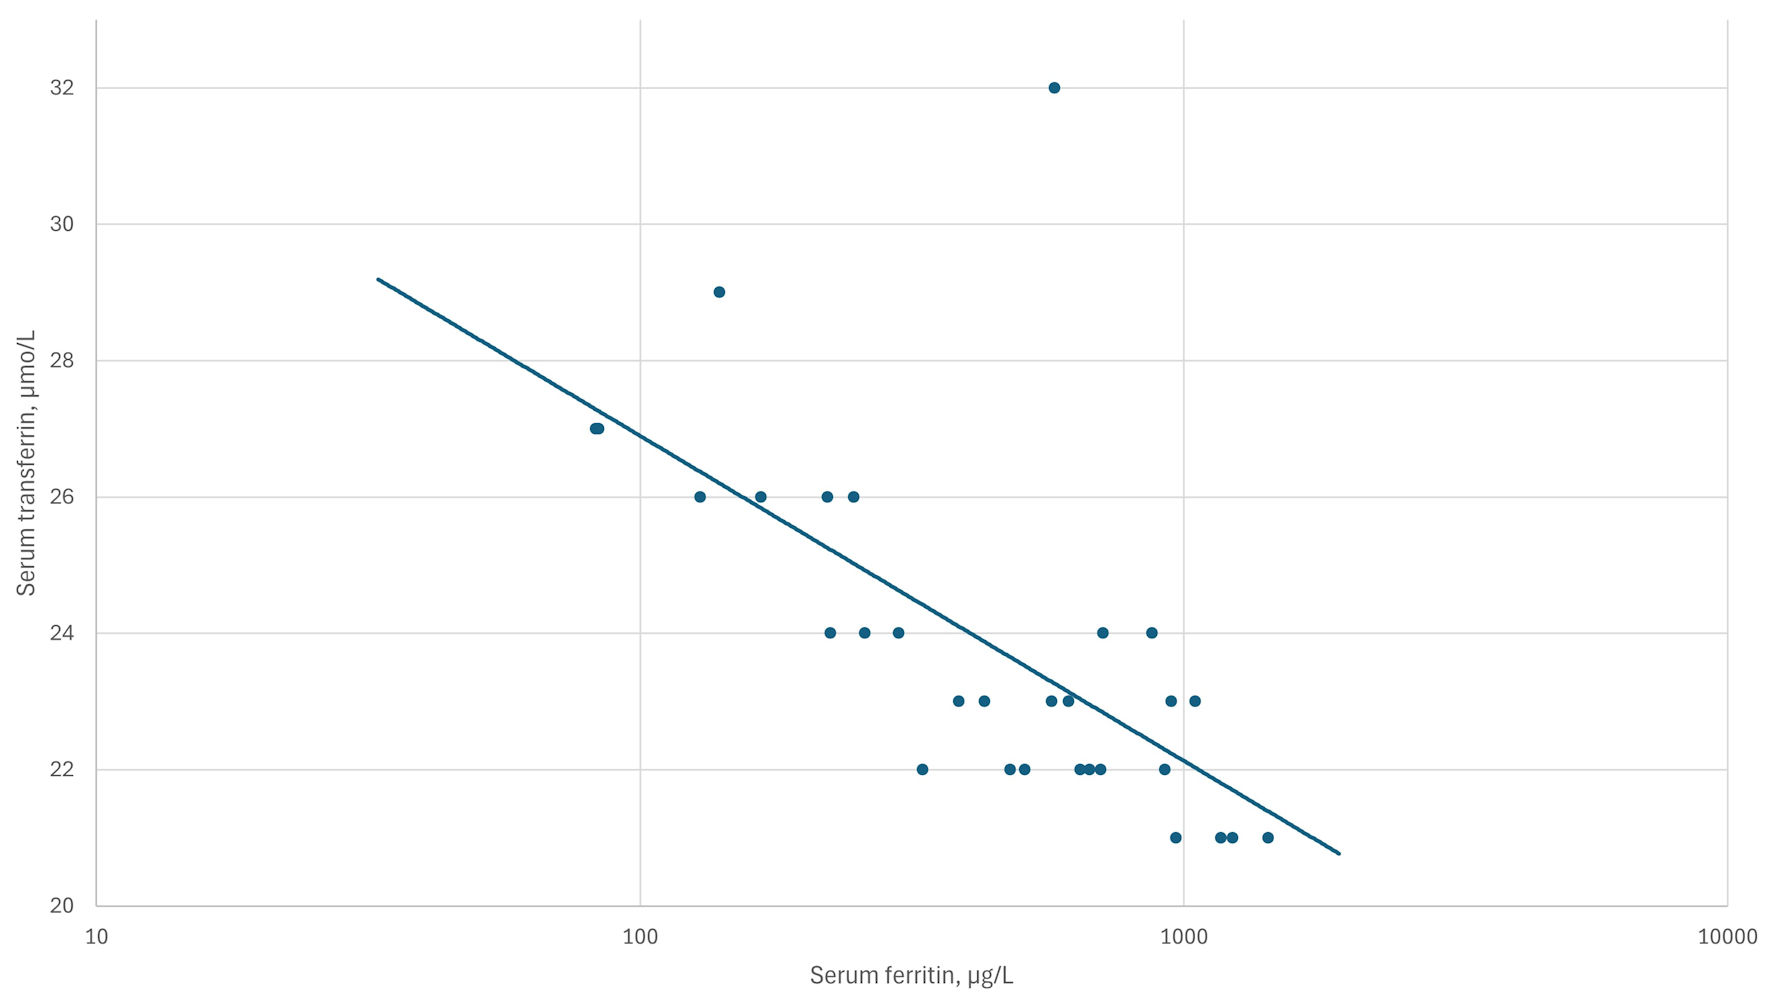 Click for large image | Figure 2. The inverse correlation between log10 serum ferritin and transferrin levels in patient F5. Correlation coefficient rs = -0.75, P < 0.0001. |
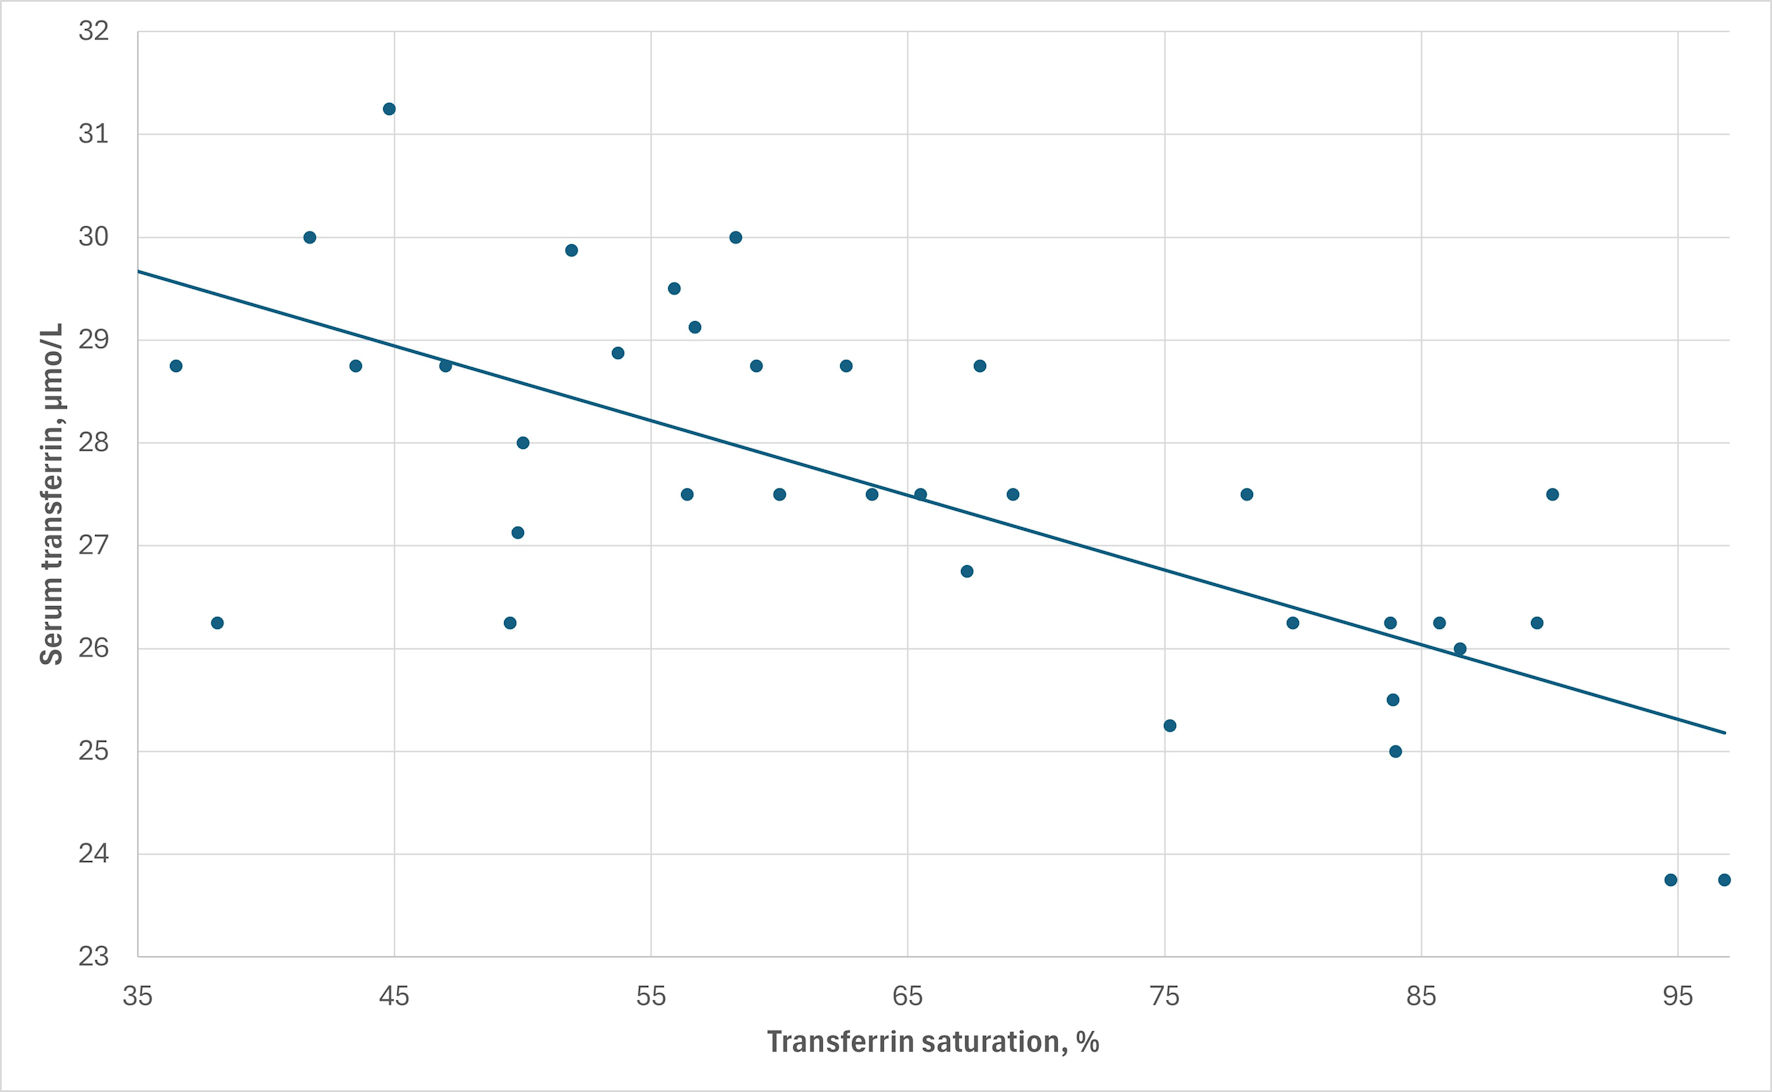 Click for large image | Figure 3. The inverse correlation between serum transferrin and transferrin saturation levels in patient M1. Correlation coefficient rs = -0.69, P < 0.0001. |
The results in men are shown in Table 2 and in women in Table 3. The findings in men and women were comparable except concerning the correlations between iron vs. transferrin and transferrin vs. TSAT, where men had significantly higher negative correlation coefficients than women. As the tables may be difficult to overview, the results are presented step by step as follows.
Click to view | Table 2. Correlations Between Serum Iron Status Markers in Men With HFE-C282Y/C282Y Hemochromatosis |
Click to view | Table 3. Correlations Between Serum Iron Status Markers in Women With HFE-C282Y/C282Y Hemochromatosis |
Iron vs. ferritin
All 21 patients showed positive correlations (median 0.51; range: 0.03 - 0.92), which were significantly different from the corresponding correlations in controls for nine patients. In general, correlations were higher than those in controls, showing correlations of 0.07 - 0.21 (Table 1).
Iron vs. transferrin
Seventeen of 21 patients showed negative correlations (median -0.35; range: -0.01 to -0.68), which were significantly different from those in controls in eight patients. Most of them differed markedly from the correlations of -0.05 to 0.07 in controls. Men had higher negative correlations (median -0.38) than women (median -0.12; P = 0.02).
Ferritin vs. transferrin
Sixteen of 21 patients showed clearly negative correlations (median -0.59; range: -0.1 to -0.85), significantly different from the correlations in controls in 13 patients and differing from the slightly negative correlations of -0.08 to -0.17 in controls.
Iron vs. TSAT
All patients displayed positive correlations (median 0.92; range: 0.43 - 0.98), being similar to the values of 0.89 - 0.91 in controls.
Ferritin vs. TSAT
Twenty of 21 patients showed clearly positive correlations (median 0.51; range: 0.02 to 0.91), in general being higher than the values of 0.14 to 0.23 in controls.
Transferrin vs. TSAT
Twenty of 21 patients showed negative correlations (median -0.57; range: -0.11 to -0.92), in general being numerically higher than the -0.35 to -0.39 in controls. Men had higher negative correlations (median -0.69) than women (median -0.37; P = 0.02).
Transferrin concentrations
Twenty of 21 patients had significantly lower transferrin levels compared with controls. Interestingly, patient M8, displaying positive correlations between iron/ferritin vs. transferrin also had a low transferrin concentration.
In men as well as women, the negative correlations between iron and ferritin vs. transferrin were present both during induction and maintenance treatment.
In the three patients showing positive correlations between iron and ferritin vs. transferrin (Tables 2, 3), we could not check whether their information was correct. However, all three had significantly lower transferrin levels than controls, in accordance with all the other patients.
| Discussion | ▴Top |
One of the key findings of this study is that all HFE-patients had significantly lower transferrin levels than controls, thus confirming the primary results from Denmark in 1991 [4] and a study from Portugal in 2005 [11]. However, even it appears to be a physiological dilemma, as a low transferrin implies a higher TSAT and consequently a higher level of NTBI [3], it has drawn little scientific attention.
Human clinical studies of transferrin synthesis and degradation in HFE-hemochromatosis are lacking, so we do not know whether it may be caused by a direct or indirect influence of the HFE-C282/C282 variant.
In the control group, women with iron deficiency had higher transferrin than women with “normal” iron status, and men with high iron reserves had slightly lower transferrin than those with “normal” iron status (Table 1), suggesting an upregulation of transferrin synthesis in iron deficiency and a downregulation in iron overload. Interestingly, both genders displayed low negative correlations between TSAT and transferrin, which consequently should be considered as a “normal” physiological phenomenon. However, this negative correlation was far more pronounced in HFE patients.
Another frequently noted aspect is that transferrin is an acute-phase reactant, declining in states of inflammation [3, 12]. There is evidence that iron overload can induce inflammation by the Fenton reaction, which may contribute to low transferrin levels [13, 14].
Could the low transferrin be a physiological consequence of iron overload, as suggested by the finding in controls? Consider that both iron and ferritin show negative correlations with transferrin in HFE-patients; however, this correlation is present both during induction and subsequent maintenance treatment, when the iron surplus has been removed. In fact, in clinical practice, many HFE-patients, despite iron deprivation, have persistently low transferrin levels and high TSAT levels, which decline only when the patients are on the edge of iron deficiency (Supplementary Materials 1-3, gr.elmerpub.com).
We can only speculate whether the low transferrin may be caused by 1) decreased synthesis and normal degradation; 2) decreased synthesis and increased degradation; 3) normal synthesis and increased degradation; 4) increased synthesis and even higher degradation.
Serving as the primary iron transporter, transferrin carries iron from sites of intestinal absorption, from macrophages, and from the liver to the tissues to fulfil their demands for iron. Iron uptake is then mediated by transferrin receptors present on cell membranes [15].
The synthesis of transferrin occurs predominantly in the liver, and its half-life is about 8 - 10 days. It is estimated that the transferrin molecule can deliver iron to the cells 100 times before degradation. It is generally stated that transferrin production is upregulated in iron deficiency and downregulated in iron overload [12], but these statements lack relevant references, and there appear to be sparse clinical human studies to support these statements. No studies seem to have measured the rate of transferrin synthesis in simple iron deficiency and simple iron overload. However, in simple iron deficiency, soluble serum transferrin receptor is clearly upregulated as the cells are craving more iron [15].
Our results show that in apparently healthy men and women with “normal” iron status, there exist no significant correlations between iron and ferritin vs. transferrin. However, women with iron deficiency had significantly higher transferrin and displayed inverse correlations between iron and ferritin vs. transferrin, indicating an upregulation of transferrin production (Table 1). Thereby supporting the above statement with respect to iron deficiency.
Healthy men with ferritin values above 300 µg/L, like men with “normal” iron status, showed no correlations between iron and ferritin vs. transferrin, suggesting that the high ferritin values may be physiological and not of pathological significance. Notably, transferrin levels were slightly but significantly lower in these men, suggesting a downregulation of transferrin synthesis in men with ample body iron reserves. However, our series was too small to draw firm conclusions.
There seem to be no studies of transferrin synthesis in HFE-C282Y/C282Y-knock-in mice. A study in HFE-knock-out mice reported that these mice degraded transferrin significantly faster than normal wild-type mice and had significantly lower transferrin concentrations [16]. They found a highly significant inverse correlation between TSAT and transferrin half-life for both HFE-deficient and wild-type mice. The authors concluded that “HFE does not seem to have a direct effect on transferrin catabolism but may influence transferrin half-life indirectly through its effect on TSAT, which in turn enhances transferrin decay in HFE-deficient mice.” The study suggests that a high TSAT may increase transferrin degradation, possibly through wear and tear. It is, however, dubious whether we can transfer the results from HFE-deficient mice to subjects who are not HFE-deficient but have the C282Y/C282Y variant.
A study used the human hepatoma cell line HepG2, which is HFE-wt/wt, to investigate the effect of different iron levels in the media on transferrin synthesis [17]. They reported that transferrin synthesis was consistently decreased following treatment with iron in the form of hemin or ferric citrate, compared to treatment with the iron chelator, desferrioxamine. Thus, that study provided evidence that iron per se can contribute to the regulation of transferrin synthesis in hepatocytes. Again, it is questionable whether one may transfer the results from HFE-wt/wt hepatocytes to subjects having hepatocytes presenting the C282Y/C282Y variant.
At least two hypotheses can be proposed regarding transferrin synthesis/degradation: 1) Iron levels by itself regulate the process, e.g., synthesis is upregulated in iron deficiency (as reflected by high transferrin in women with ferritin < 30 µg/L) and downregulated in iron overload (as reflected by lower transferrin in men with ferritin > 300 µg/L). 2) The C282Y/C282Y variant may affect transferrin synthesis or, more likely, its degradation, through inappropriately high TSAT, persisting even when iron reserves are low and wearing out the transferrin molecule faster than normal. The latter assumption is supported by the mouse study [16] and the fact that both controls and patients (except M8) in the present study displayed consistently negative correlations between TSAT and transferrin (Tables 1-3).
The positive correlations between iron and ferritin reflect the close interrelationship between these two iron status parameters, in which the primary event is increased iron absorption, followed secondarily by increased ferritin synthesis. This may indirectly explain why ferritin, like iron, also displays negative correlations with transferrin. This finding is supported by the results in a HepG2 cell study [18].
The initial biochemical hallmark of HFE-hemochromatosis is an elevated TSAT, which occurs even before ferritin and iron reserves start to rise [3], suggesting that the culprit is associated with the C282Y/C282Y gene. The consistently inverse correlations between iron and transferrin and between ferritin and transferrin in HFE-patients, compared to controls, appear to be a novel finding. Why are there inverse correlations between iron and ferritin concentrations vs. transferrin concentrations? To what extent do lower transferrin levels contribute to an even higher TSAT? Is the hemochromatosis genotype associated with an abnormal downregulation of transferrin synthesis, or is this a “normal” physiological response? Could the transferrin molecules in any way be dysfunctional, undergoing faster degradation despite a possibly increased synthesis? A recent paper using genome-wide association study (GWAS) in C282Y/C282Y homozygotes identified the rs3811647 polymorphism in the transferrin gene as being associated with iron metabolism by influencing iron and transferrin levels [19]. The frequency of rs3811647 GG homozygosity was around 43% in their patient series, being similar to the frequency in the background population. Whether this mutation contributes to higher TSAT awaits further evaluation. There exist methods to measure transferrin synthesis in humans, but to the knowledge of the author, they have not been applied to patients with hemochromatosis. However, the HepG2 HFE-wt/wt cell studies showed that cellular transferrin synthesis is reduced in the presence of iron surplus and increased in the iron deficient state, indicating a direct effect of iron on this process [17].
There are no studies on liver cell tissue from hemochromatosis patients. Further clinical studies of transferrin synthesis are indicated to answer these important questions.
To make the understanding of the logistics of iron metabolism even more complex, studies using cell cultures have shown that the wild-type HFE protein forms a stable complex with the transferrin receptor on the cell membrane, which decreases its affinity for transferrin-iron binding. However, the mutated C282Y protein markedly eliminates this interaction, which in hemochromatosis results in increased cellular transferrin-iron uptake and contributes to excessive cellular iron deposition [20, 21].
In healthy individuals, iron deficiency (TSAT below 25%) increases the serum soluble transferrin receptor levels, while iron overload decreases them. However, illogically, it appears that C282Y hemochromatosis patients have an upregulation of the soluble transferrin receptor starting already when TSAT drops below 50% [22], which contributes to a further increase of iron transport into the cells. This observation suggests that the HFE protein is involved as a sensor of systemic iron availability.
Thus, the HFE-C282Y variant, in the present socioeconomic settings, has multiple inappropriate effects on iron metabolism. It affects the hepcidin iron pathway, causing intestinal hyperabsorption, and also alters cellular iron logistics with low serum transferrin levels, increased affinity for the transferrin-iron complex to the transferrin receptor, and upregulation of the cellular transferrin receptor, even in states of iron overload.
Conclusions
HFE-C282Y/C282Y hemochromatosis patients have markedly lower serum transferrin levels than healthy HFE-wt/wt control persons, which contribute to a higher TSAT; the explanation for this remains unsolved. Furthermore, hemochromatosis patients display clear negative correlations between serum iron and serum ferritin vs. transferrin, as well as high negative correlations between TSAT and transferrin, suggesting that high TSAT levels accelerate the degradation of transferrin, as shown in HFE-knock-out mice [16].
Healthy subjects with low ferritin (< 30 µg/L) have higher transferrin, and those with high ferritin (> 300 µg/L) have lower transferrin than subjects with “normal” iron status, suggesting a direct effect of iron on transferrin synthesis. This is supported by studies in HepG2-HFE-wt/wt cells [17].
The mechanisms responsible for transferrin metabolism, i.e., synthesis and degradation, in hemochromatosis patients are not clarified, and the possible influence of the C282Y/C282Y variant on these processes is unknown. Contrary to a “normal” physiologic metabolism, which is mainly regulated by serum iron levels (see above), transferrin remains low and TSAT high even in many iron-depleted hemochromatosis patients. It would be valuable to explore whether this decrease in transferrin reflects reduced hepatic synthesis or increased degradation. There is a definite need for further investigation of this important dilemma in HFE-hemochromatosis.
| Supplementary Material | ▴Top |
Suppl 1. A 73-year-old male patient M1 (results of 37 consecutive blood samples during maintenance treatment) who was treated for HFE-C282Y/C282Y hemochromatosis for 19 years.
Suppl 2. A 59-year-old female patient F5 (results of 30 consecutive blood samples during induction treatment) who was treated for HFE-C282Y/C282Y hemochromatosis for 3.5 years.
Suppl 3. A 63-year-old male patient M10 (results of 28 consecutive blood samples during maintenance treatment) who was treated for HFE-C282Y/C282Y hemochromatosis for 13 years.
Acknowledgments
The author thanks the participating members of the Danish Hemochromatosis Association for their valuable contribution to this study. The author is grateful to CEO Kristian Krogh and CEO Eskil Krogh, Pharmovital ApS, Rosenkaeret 11B, DK-2860 Soborg, Denmark, for assistance with the survey and statistical calculations.
Financial Disclosure
The study was supported by The Health Insurance Foundation (grant H 11-23-89), The Danish Hospital Foundation for Medical Research, Region of Copenhagen, The Faroe Islands and Greenland (grant 46-83), The Research Foundation of the Danish Voluntary Blood Donors, and the Danish Health Authority. The Danish Hemochromatosis Association provided the expenses for publication of the article. The funding sources were not involved in the study design, data collection, analysis and interpretation, manuscript writing, or the decision to submit the article for publication.
Conflict of Interest
The author declares to have no conflict of interest.
Informed Consent
All participants provided informed consent to participate in the DAN-MONICA study. The participants recruited through the Danish Hemochromatosis Association participated voluntarily and anonymously.
Author Contributions
NTM provided blood samples and the analyses of hematologic iron status markers from the DAN-MONICA population study. Statistical analyses were performed by NTM, and the manuscript was written by NTM.
Data Availability
The data supporting the findings of this study are available from the corresponding author upon reasonable request.
Abbreviations
NTBI: non-transferrin-bound iron; TIBC: total iron-binding capacity; TSAT: transferrin saturation; UIBC: unsaturated iron-binding capacity
| References | ▴Top |
- Girelli D, Marchi G, Busti F. Diagnosis and management of hereditary hemochromatosis: lifestyle modification, phlebotomy, and blood donation. Hematology Am Soc Hematol Educ Program. 2024;2024(1):434-442.
doi pubmed - Association for Laboratory Medicine. LabTestsOnlineUK. Last modified on 9 May 2022. https://labtestsonline.org.uk/tests/tibc-uibc-and-transferrin. Accessed November 12, 2025.
- Milman NT, Ellervik C. Should serum transferrin saturation be included as a therapeutic target in addition to serum ferritin in treating HFE-hemochromatosis? Am J Hematol. 2025.
doi pubmed - Milman N. Iron status markers in hereditary haemochromatosis: distinction between individuals being homozygous and heterozygous for the haemochromatosis allele. Eur J Haematol. 1991;47(4):292-298.
doi pubmed - Milman NT. Associations between the HFE genotypes and iron status markers in an apparently healthy population. Gastroenterology Res. 2025;18(2):63-70.
doi pubmed - Dansk Hæmokromatose Forening. Danish Hemochromatosis Association. https://haemokromatose.dk.
- Milman N, Kirchhoff M. Iron stores in 1433, 30- to 60-year-old Danish males. Evaluation by serum ferritin and haemoglobin. Scand J Clin Lab Invest. 1991;51(7):635-641.
doi pubmed - Milman N, Kirchhoff M. Iron stores in 1359, 30- to 60-year-old Danish women: evaluation by serum ferritin and hemoglobin. Ann Hematol. 1992;64(1):22-27.
doi pubmed - MedCalc Software Ltd, Ostend, Belgium; https://www.medcalc.org; 2025.
- Lenhard W, Lenhard AL. Hypothesis tests for comparing correlations. Psychometrica 2014. Available: https://www.psychometrica.de/correlation.html.
doi - Macedo MF, Cruz E, Lacerda R, Porto G, de Sousa M. Low serum transferrin levels in HFE C282Y homozygous subjects are associated with low CD8(+) T lymphocyte numbers. Blood Cells Mol Dis. 2005;35(3):319-325.
doi pubmed - Rusch JA, van der Westhuizen DJ, Gill RS, Louw VJ. Diagnosing iron deficiency: Controversies and novel metrics. Best Pract Res Clin Anaesthesiol. 2023;37(4):451-467.
doi pubmed - Broedbaek K, Poulsen HE, Weimann A, Kom GD, Schwedhelm E, Nielsen P, Boger RH. Urinary excretion of biomarkers of oxidatively damaged DNA and RNA in hereditary hemochromatosis. Free Radic Biol Med. 2009;47(8):1230-1233.
doi pubmed - Cejvanovic V, Kjaer LK, Bergholdt HKM, Torp-Pedersen A, Henriksen T, Weimann A, Ellervik C, et al. Iron induced RNA-oxidation in the general population and in mouse tissue. Free Radic Biol Med. 2018;115:127-135.
doi pubmed - Girelli D, Marchi G, Busti F, Chesini F, Castagna A. Diagnostics: markers of body iron status. Adv Exp Med Biol. 2025;1480:387-398.
doi pubmed - Chaudhury C, Kim J, Mehnaz S, Wani MA, Oberyszyn TM, Bronson CL, Mohanty S, et al. Accelerated transferrin degradation in HFE-deficient mice is associated with increased transferrin saturation. J Nutr. 2006;136(12):2993-2998.
doi pubmed - Barnum-Huckins K, Adrian GS. Iron regulation of transferrin synthesis in the human hepatoma cell line HepG2. Cell Biol Int. 2000;24(2):71-77.
doi pubmed - Hubert N, Lescoat G, Sciot R, Moirand R, Jego P, Leroyer P, Brissot P. Regulation of ferritin and transferrin receptor expression by iron in human hepatocyte cultures. J Hepatol. 1993;18(3):301-312.
doi pubmed - de Tayrac M, Roth MP, Jouanolle AM, Coppin H, le Gac G, Piperno A, Ferec C, et al. Genome-wide association study identifies TF as a significant modifier gene of iron metabolism in HFE hemochromatosis. J Hepatol. 2015;62(3):664-672.
doi pubmed - Feder JN, Penny DM, Irrinki A, Lee VK, Lebron JA, Watson N, Tsuchihashi Z, et al. The hemochromatosis gene product complexes with the transferrin receptor and lowers its affinity for ligand binding. Proc Natl Acad Sci U S A. 1998;95(4):1472-1477.
doi pubmed - Lebron JA, West AP, Jr., Bjorkman PJ. The hemochromatosis protein HFE competes with transferrin for binding to the transferrin receptor. J Mol Biol. 1999;294(1):239-245.
doi pubmed - Brandao M, Oliveira JC, Bravo F, Reis J, Garrido I, Porto G. The soluble transferrin receptor as a marker of iron homeostasis in normal subjects and in HFE-related hemochromatosis. Haematologica. 2005;90(1):31-37.
pubmed
This article is distributed under the terms of the Creative Commons Attribution Non-Commercial 4.0 International License, which permits unrestricted non-commercial use, distribution, and reproduction in any medium, provided the original work is properly cited.
Gastroenterology Research is published by Elmer Press Inc.