| Gastroenterology Research, ISSN 1918-2805 print, 1918-2813 online, Open Access |
| Article copyright, the authors; Journal compilation copyright, Gastroenterol Res and Elmer Press Inc |
| Journal website https://gr.elmerpub.com |
Original Article
Volume 000, Number 000, June 2025, pages 000-000

Trends in Hepatitis C and Hepatitis B Deaths Identify Successes and Disparities, Alameda County, CA, 2005 - 2022
Beimnet F. Tayea, b, c, Amit S. Chitnisa, Emily Yettea, Matt Beyersd, Robert J. Wonge, f, Eileen F. Dunnea, g
aDivision of Communicable Disease Control and Prevention, Alameda County Public Health Department, Alameda Health, San Leandro, CA, USA
bInfectious Diseases and Vaccinology, School of Public Health, University of California, Berkeley, CA, USA
cCurrent affiliation: UCLA, Los Angeles, CA, USA
dCommunity Assessment, Planning, and Evaluation, Alameda County Public Health Department, Alameda Health, San Leandro, CA, USA
eDivision of Gastroenterology and Hepatology, Stanford University School of Medicine, Palo Alto, CA, USA
fVeterans Affairs Palo Alto Healthcare System, Palo Alto, CA, USA
gCorresponding Author: Eileen F. Dunne, Division of Communicable Disease Control and Prevention, Alameda County Public Health Department, Alameda Health, San Leandro, CA, USA
Manuscript submitted April 7, 2025, accepted June 2, 2025, published online June 16, 2025
Short title: HCV and HBV Deaths in Alameda County
doi: https://doi.org/10.14740/gr2042
| Abstract | ▴Top |
Background: Hepatitis B virus (HBV) and hepatitis C virus (HCV) mortality is a metric for viral hepatitis elimination. Assessments of HBV and HCV mortality at the local level can focus viral hepatitis prevention efforts.
Methods: We conducted a cross-sectional and trend analysis of Alameda County residents with HBV or HCV who died in California, using California’s Integrated Vital Records System, 2005 - 2022. We selected International Statistical Classification of Diseases and Related Health Problems, Tenth Revision (ICD-10) codes specific to HBV, HCV, or both, as a cause of death. We used Joinpoint regression to investigate trend differences in age-adjusted HCV mortality rates by sex, race/ethnicity, and Healthy Places Index (HPI) quartiles.
Results: A total of 2,165 HBV and HCV deaths were identified in Alameda County (313 HBV, 1,809 HCV, and 43 co-infected deaths). Most HBV decedents were Asian (73.2%) and born outside the United States (78.9%). Age-adjusted HCV mortality rates decreased for all groups from 2013 to 2022; HBV mortality did not decline. African American/Black and Hispanic/Latinx residents had smaller percent decreases in HCV mortality than Asian residents (average annual percent change (AAPC) difference: 6.6% (0.4%, 12.9%); P = 0.04 and 9.3% (3.5%, 15.1%); P = 0.002). The least advantaged HPI quartile 1 had a smaller percent decrease in HCV mortality than the most advantaged HPI quartile 4 (AAPC difference: 8.3% (3.6%, 12.9%); P = 0.01).
Conclusions: We identified successes, challenges, and disparities in the burden and trends of HBV and HCV deaths in Alameda County. Focused efforts to expand viral hepatitis screening, vaccination, and treatment are needed to address these gaps and reach elimination targets.
Keywords: Hepatitis B; Hepatitis C; Mortality; Trends; Health disparities
| Introduction | ▴Top |
Hepatitis B virus (HBV) and hepatitis C virus (HCV) infections are associated with substantial morbidity and mortality [1]. The World Health Organization (WHO) estimates a total of 254 million people living with chronic HBV infection and 50 million living with chronic HCV infection globally in 2022 [1]. In 2021, the mortality rates for HBV and HCV were 0.44/100,000 persons and 3.18/100,000 persons in the United States; however, this may underestimate the true national burden due to suboptimal testing and diagnosis of individuals with HBV and HCV [2].
Hepatitis B and C prevalence and mortality vary by race/ethnicity and geography highlighting the need to assess local burden and trends [3]. Non-Hispanic Asian/Pacific Islanders have a 14.2-fold higher HBV prevalence and 9.8-fold higher mortality rate compared to non-Hispanic Whites; non-Hispanic American Indian and Alaskan Natives have a 2.4-fold higher HCV prevalence and 2.8-fold higher mortality rate compared to non-Hispanic Whites [2, 4]. Of 15 California counties examined, Alameda County had the third highest seroprevalence of chronic HBV [5]. Additionally, Alameda County’s chronic HCV rate is 1.2 times higher than that of California’s [6]. In California, the HBV and HCV mortality rates are 1.8 and 1.3 times that of national rates, respectively [4, 7].
As stated in national and global HBV and HCV elimination plans, reducing viral hepatitis mortality and achieving elimination is contingent upon evaluation of local data to effectively use public health resources [8-10]. Few studies have characterized HBV and HCV mortality using local data, and, to our knowledge, none have compared recent mortality trends by race/ethnicity, sex, and socio-economic status [11, 12]. We described HBV and HCV mortality rates and trends from 2005 to 2022 in Alameda County, CA. Assessment of local data on HBV and HCV mortality supports hepatitis elimination efforts by tracking progress but also pointing to needed focus to address identified disparities.
| Materials and Methods | ▴Top |
Setting
Alameda County is an urban setting with a total population of 1.53 million excluding City of Berkeley in 2022. For this analysis, we excluded decedents residing in the City of Berkeley, which has its own public health department. Approximately 10.2% of residents are African American/Black, 32.1% are Asian, and 22.2% are Hispanic/Latinx. In 2022, 33.3% were non-US born [13].
Data sources and study population
We used Alameda County mortality data from California’s Integrated Vital Records System. We received information on all deaths occurring in Alameda County as well as deaths among Alameda County residents that occurred elsewhere in California from 2005 to 2022. Each mortality record results from a unique death certificate and includes up to 20 contributing causes of death (COD) classified using codes from the World Health Organization International Statistical Classification of Diseases and Related Health Problems, Tenth Revision (ICD-10) [14]. The COD together represent each decedent’s multiple cause of death (MCOD). For each decedent, we obtained age at death, race/ethnicity, sex, census tract of residence, and nativity from mortality records. Our study population then consisted of Alameda County residents who died in California from 2005 to 2022 with HBV and/or HCV listed in the MCOD.
We defined HBV and HCV decedents as those with HBV ICD-10 codes (B16, B17.0, B18.0, B18.1) or HCV ICD-10 codes (B17.1, B18.2) in the MCOD; previous studies have used MCOD as a method to describe HBV and HCV deaths [4, 7, 15-17]. Decedents were classified into three mutually exclusive categories: HBV decedent, HCV decedent, or co-infected decedent. We used the MCOD rather than the underlying cause of death (UCOD) to identify HBV and HCV decedents because previous studies have established the unreliability of the UCOD as a sole measure to identify HBV and HCV-related deaths [15, 18]. Based on prior literature review, we used ICD-10 codes to identify the following HBV- and HCV-related conditions of interest in the MCOD: alcohol-associated liver disease, hepatocellular carcinoma (HCC), cirrhosis, liver failure, human immunodeficiency virus (HIV), diabetes, drug dependence, and cardiovascular conditions (Supplementary Material 1, gr.elmerpub.com) [15, 16]. We defined decedents as being born in the United States if their place of birth is listed in the 50 states, District of Columbia, or United States Territories.
We used The Public Health Alliance of Southern California’s Healthy Places Index (HPI) to characterize census tract-level conditions associated with health; higher HPI scores represent healthier community conditions [19]. We categorized Alameda County census tract HPI scores into quartiles, with quartile 4 containing the quarter of Alameda County tracts with the highest HPI scores, and quartile 1 containing the quarter of Alameda County tracts with the lowest HPI scores.
Statistical analyses
We stratified HBV and HCV decedents by sex, race/ethnicity, nativity, HPI quartile, and presence of other conditions of interest in the MCOD. We calculated the median age and interquartile range (IQR) for each decedent category. We used the Kruskal-Wallis test for the non-normal variable age and Pearson Chi-square tests for categorical variables when comparing between HBV and HCV decedents. All tests of significance were two-sided and assessed at α = 0.05; confidence intervals (CIs) were calculated at the 95% level.
We calculated yearly HBV and HCV mortality rates using population estimates for Alameda County, excluding City of Berkeley, derived from the 2000 and 2010 Decennial Census and Esri population estimates [20]. We directly age standardized race/ethnicity, HPI quartile, and sex-specific mortality rates using the 2010 US Census population as the standard population.
We used Joinpoint regression to investigate trend differences in age-adjusted HCV mortality rates by sex, race/ethnicity, and HPI quartiles [21]. We did not conduct HBV mortality trend differences by group as there were too few observations leading to unstable rate estimates. To investigate and compare mortality trends from 2013 to 2022, we also estimated the average annual percent change (AAPC) from 2013 to 2022 for each group. We used Joinpoint to estimate 2013 - 2022 AAPC differences and 95% CIs for pairwise comparisons that met Joinpoint’s non-parallelism criteria [22]. We used R Studio, version 4.3.0 (R Project for Statistical Computing), for all non-Joinpoint statistical analyses and all visualizations. We conducted Joinpoint regression and pairwise trend comparisons with the National Institutes of Health (NIH) Joinpoint Regression Program, version 5.0.2 [21].
The information described in this manuscript is public health surveillance data which is authorized by the public health authority and not considered human subject research.
| Results | ▴Top |
A total of 2,122 HBV or HCV deaths were identified in Alameda County from 2005 to 2022 (313 HBV deaths and 1,809 HCV deaths) (Table 1). Overall, most HBV and HCV decedents were male (68.7%) and/or White or African American/Black (33.6% and 30.2%). The median age at death for all HBV or HCV decedents was 62 (IQR: 56 - 69 years). Most (73.2%) HBV decedents were Asian, whereas most HCV decedents were either White or African American/Black (37.7% and 33.8%; P < 0.001). Most (81.8%) HCV decedents were born in the United States compared to most HBV decedents being born outside of the United States (78.9%; P < 0.001). Although 15.6% of all decedents were in HPI quartile 1 census tracts, HCV decedents were significantly more likely to reside in HPI quartile 1 census tracts compared to HBV decedents (17% vs. 7.3%; P < 0.001).
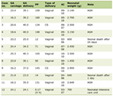 Click to view | Table 1. Characteristics of Persons Who Died With HBV, HCV, or Co-Infection, Alameda County, 2005 - 2022 |
The most common co-incident causes of death among HBV and HCV decedents were cardiovascular conditions and cirrhosis (46.3% and 42.5%). A total of 10% (n = 213) of all decedents also had concurrent diagnosis of alcohol-associated liver disease. HCV decedents were significantly more likely to have alcohol-associated liver disease listed than HBV decedents (11.3% vs. 2.6%; P < 0.001). The presence of cirrhosis was higher among HCV decedents compared to HBV decedents (43.8% vs. 34.8%; P = 0.004). Presence of HCC was higher among HBV decedents compared to HCV decedents (36.7% vs. 20.8%; P < 0.001).
There were differences between HBV and HCV crude mortality rate trends (Fig. 1). HCV crude mortality rates were higher than HBV crude mortality rates for all years. HBV crude mortality rates peaked in 2012 (1.75 deaths/100,000 persons) but remained unchanged throughout the following years, whereas HCV crude mortality rates rose from 2005 (4.8 deaths/100,000 persons) to 2012 (10 deaths/100,000 persons) followed by a decrease from 2012 to 2022 (3.39 deaths/100,000 persons). The HBV crude mortality rate for Asians was 56.6 per 100,000 persons, compared with the HBV crude mortality rate for the general population of 20.1 per 100,000 persons.
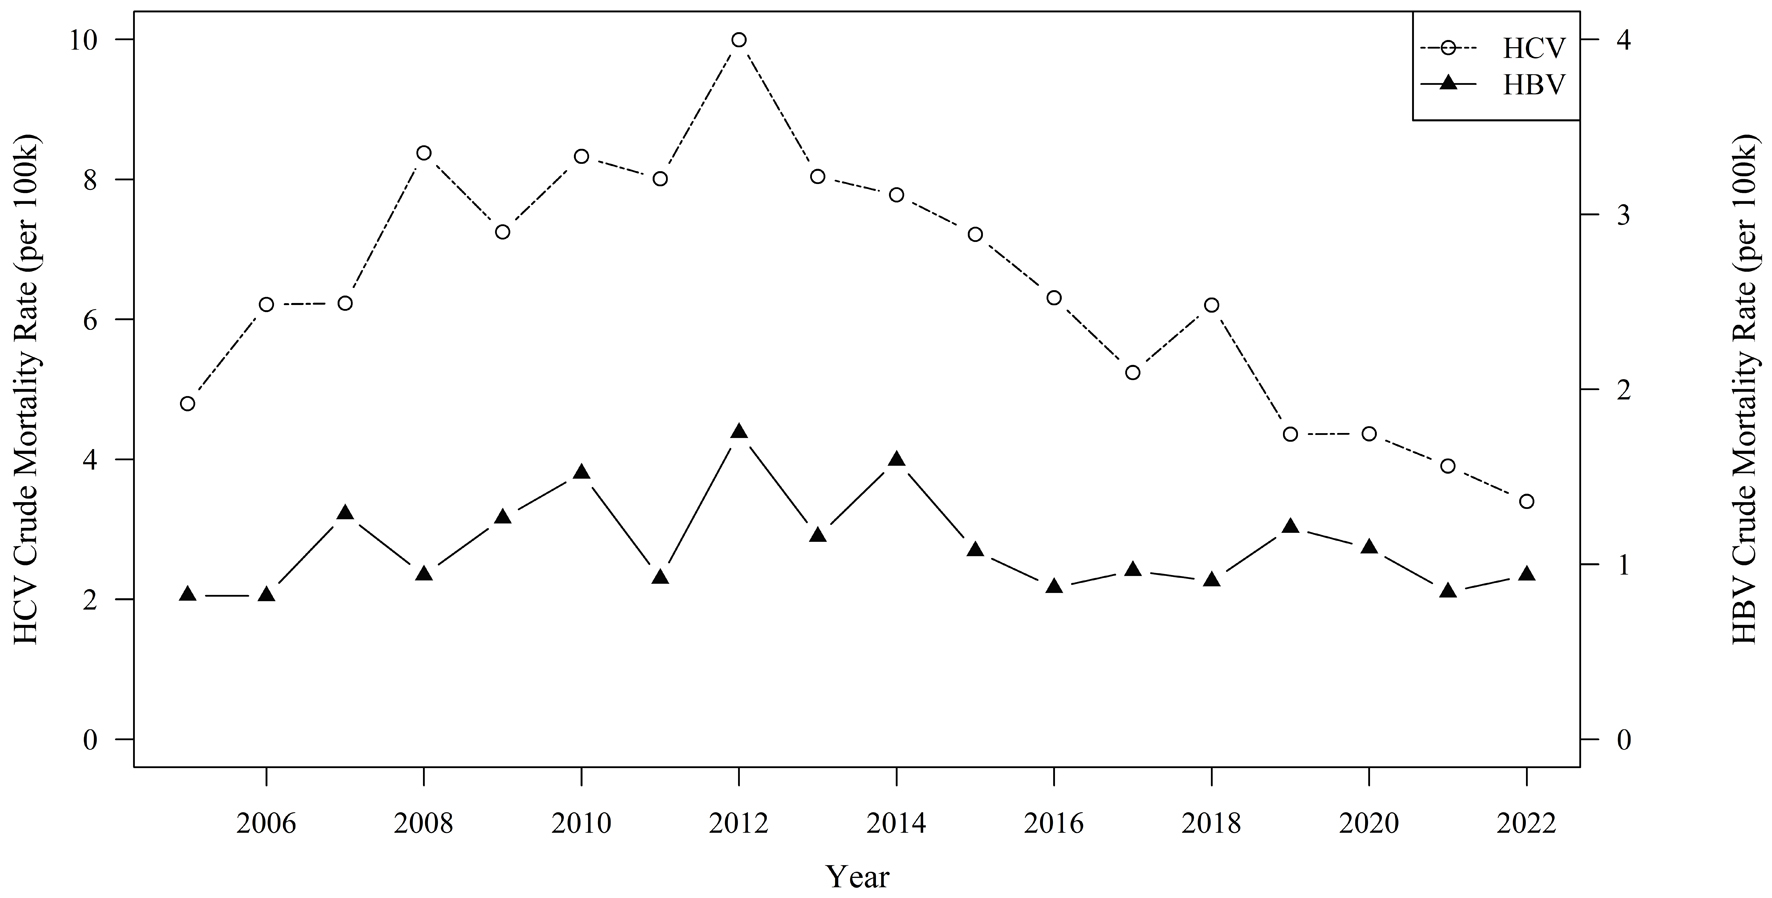 Click for large image | Figure 1. Trends in hepatitis B and hepatitis C virus crude mortality ratesa per 100,000 population, Alameda County, 2005 - 2022. aIncludes decedents with HBV or HCV listed in multiple cause of death on death certificate; excludes decedents with both HBV and HCV listed. HBV: hepatitis B virus; HCV: hepatitis C virus. |
Joinpoint modeling of HCV mortality trends by race/ethnicity found that African American/Black residents had the highest age-adjusted HCV mortality rates followed by Hispanic/Latinx residents while Asian residents had the lowest age-adjusted HCV mortality rates throughout the period (Fig. 2). HPI quartile 1 census tracts had the highest age-adjusted HCV mortality rates while quartile 4 tracts had the lowest rates throughout the period (Fig. 3). Males had higher age-adjusted HCV mortality rates than females throughout the period (not shown).
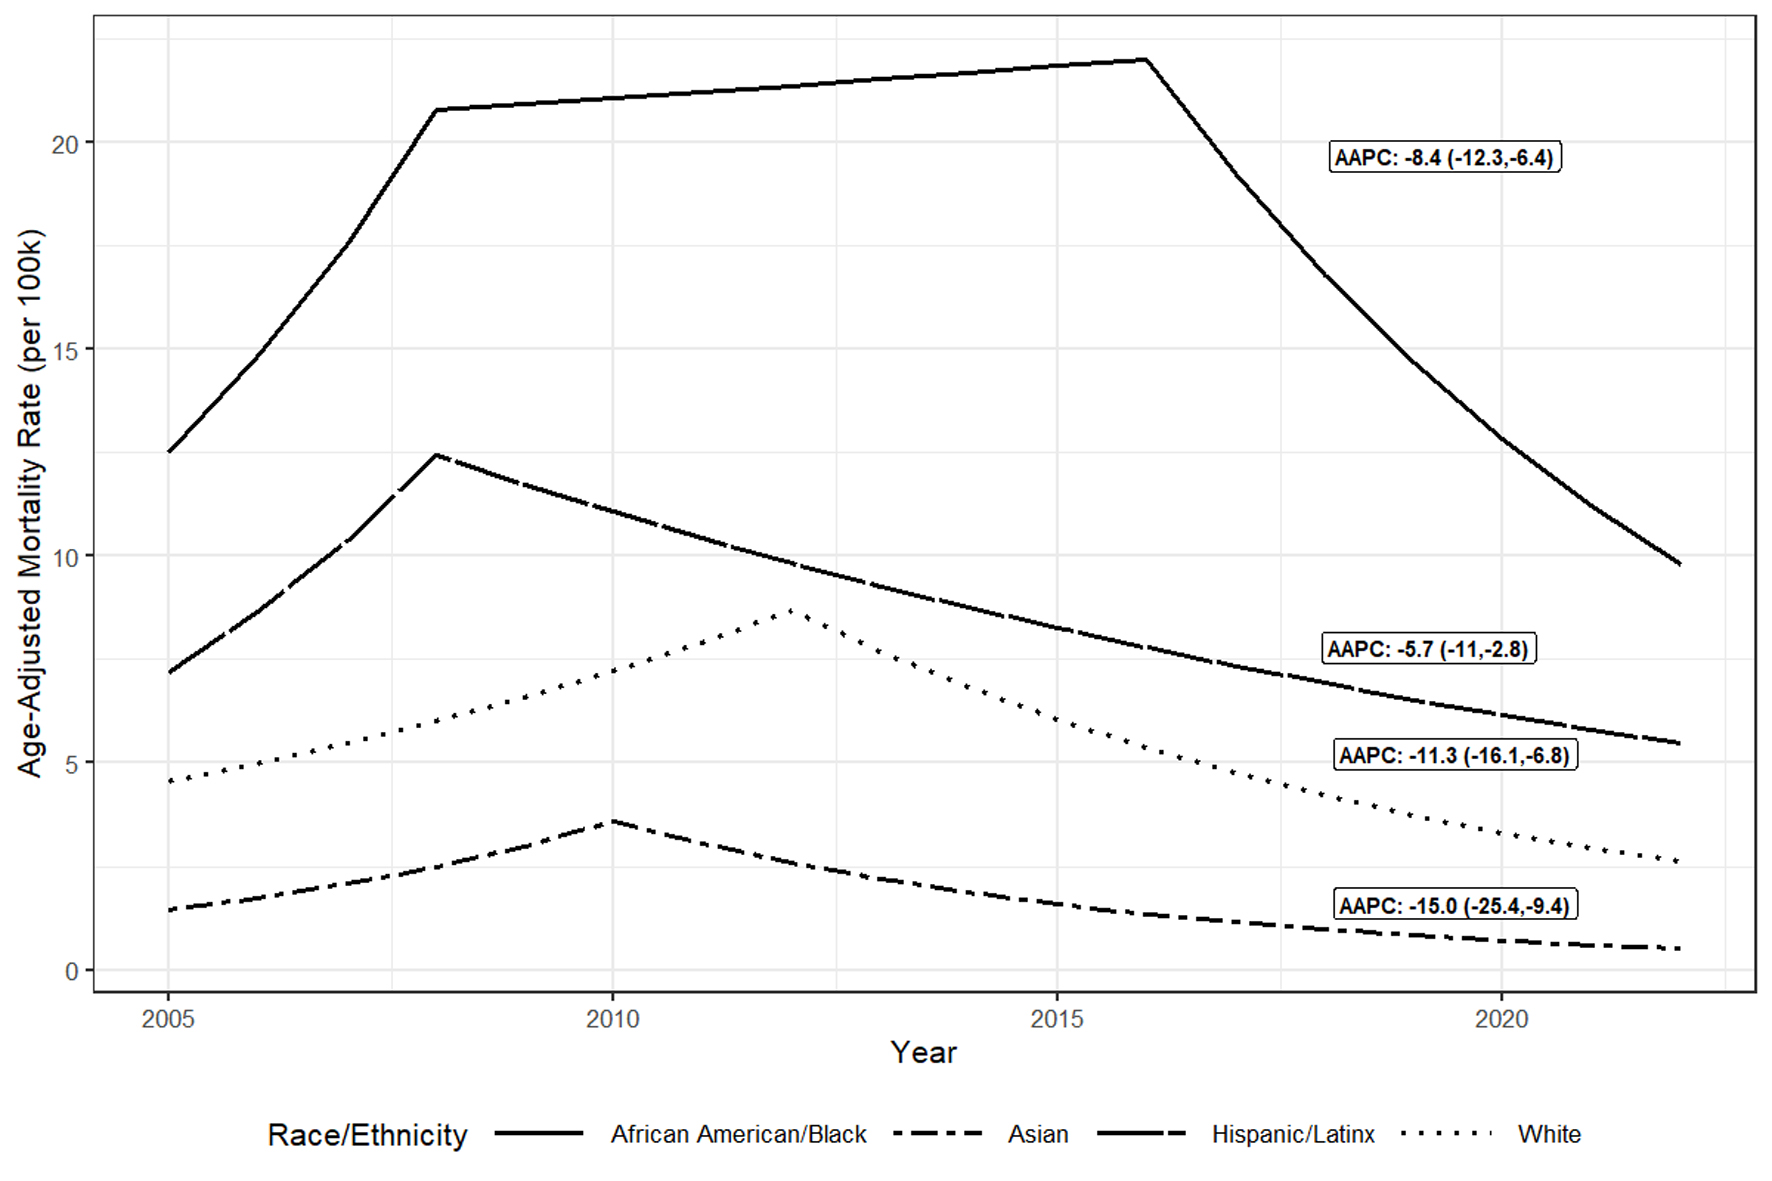 Click for large image | Figure 2. Trendsa in age-adjusted hepatitis C virus mortality ratesb per 100,000 population by race/ethnicityc, Alameda County, 2005 to 2022. aTrends in adjusted rates estimated using Joinpoint regression. bIncludes decedents with HCV listed in multiple cause of death on death certificate form; excludes decedents with both HBV and HCV listed. cToo few HCV decedents were categorized as American Indian and Alaska Native or Multirace to graph over time. AAPC: average annual percentage change; HCV: hepatitis C virus. |
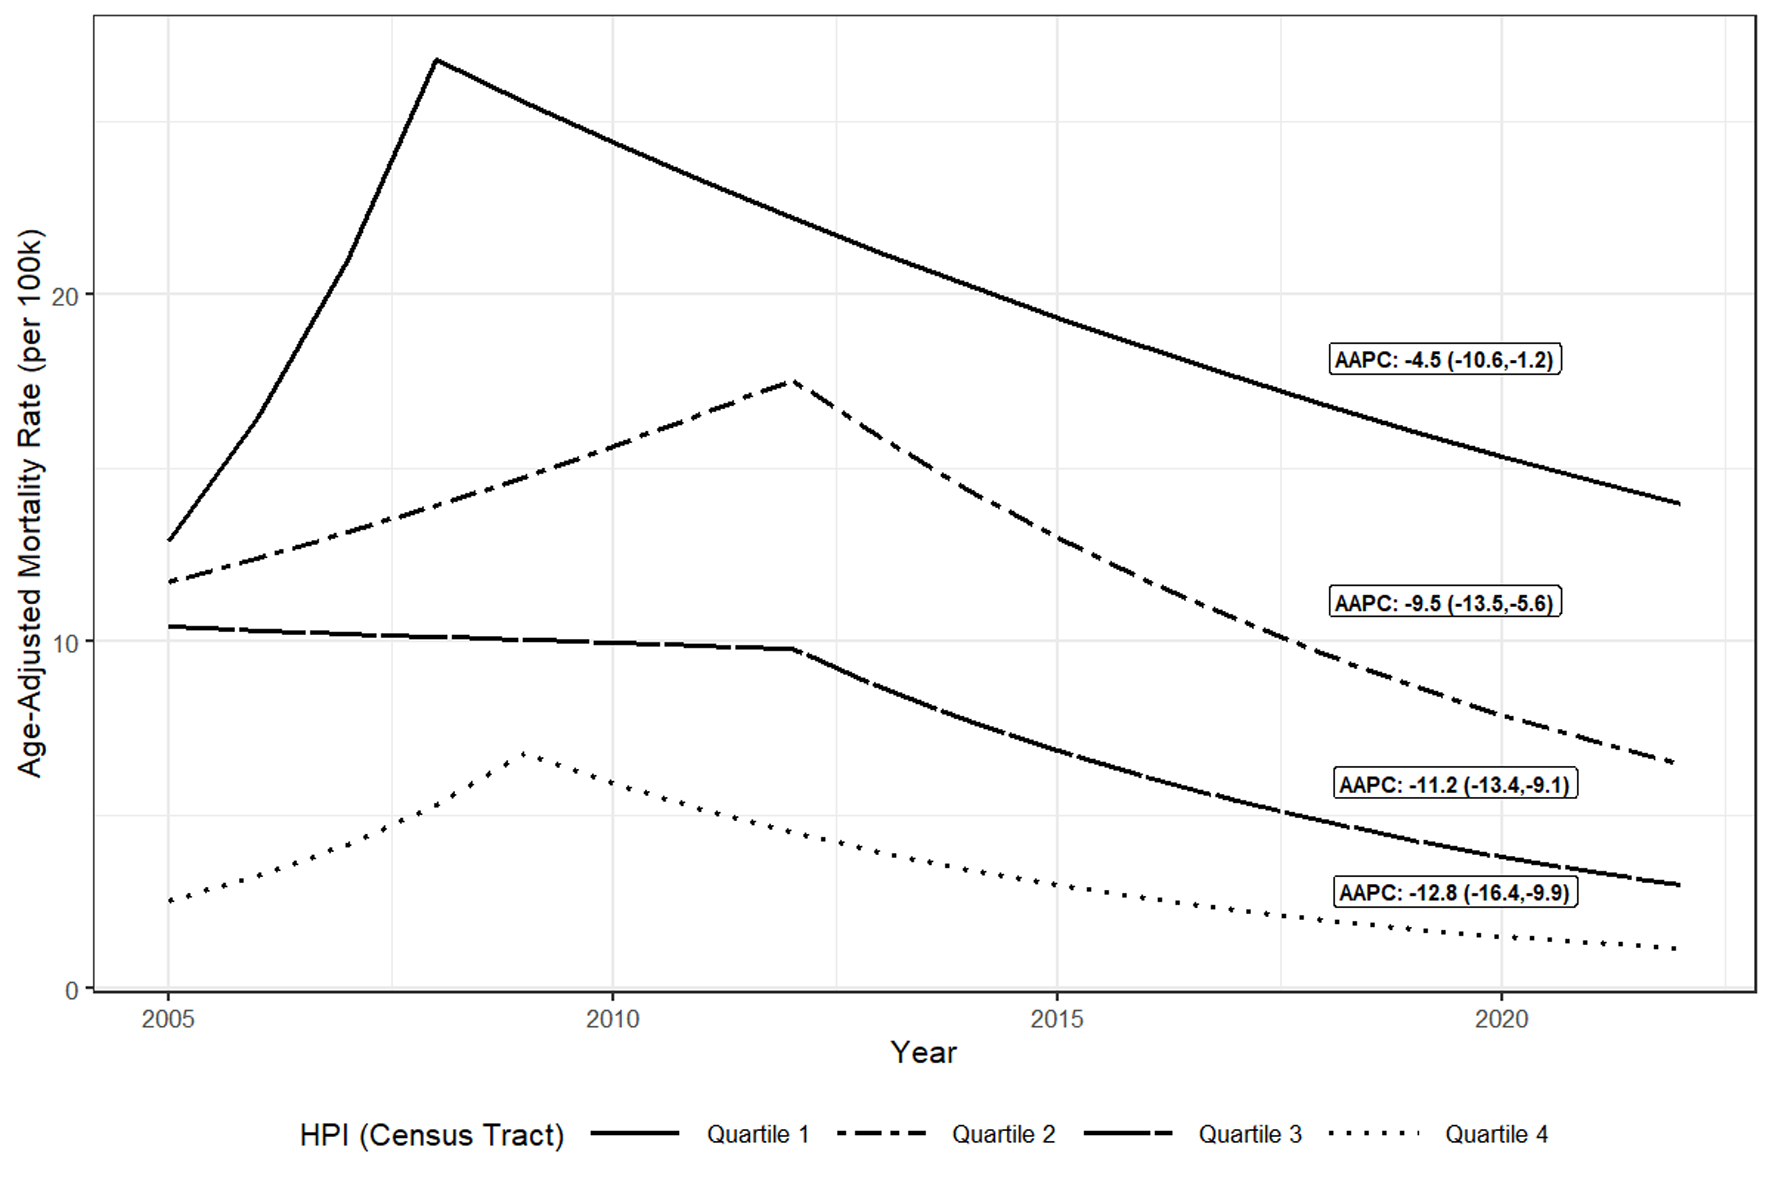 Click for large image | Figure 3. Trendsa in age-adjusted hepatitis C virus mortality ratesb per 100,000 population, by Census Tract HPI quartile, Alameda County, 2005 - 2022. aTrends in adjusted rates estimated using Joinpoint regression. bIncludes decedents with HCV listed in multiple cause of death on death certificate form; excludes decedents with both HBV and HCV listed. AAPC: average annual percentage change; HCV: hepatitis C virus; HPI: Healthy Places Index. |
When comparing adjusted HCV mortality rate trends across HPI quartile, race/ethnicity, and sex, HCV mortality rates declined for all groups from 2013 to 2022 (Table 2); however, there were relative differences in declines by race/ethnicity and HPI quartile. From 2013 to 2022, African American/Black and Hispanic/Latinx residents had the smallest (2013 - 2022 AAPC: -8.4 (-12.3, -6.4) and -5.7 (-11, -2.8)) relative decreases in HCV mortality rates whereas Asian residents had the largest (2013 - 2022 AAPC: -15.0 (-25.4, -9.4)). Pairwise comparison tests found this difference in decline comparing adjusted rates among African American/Black and Hispanic/Latinx residents with Asian residents as statistically significant (2013 - 2022 AAPC differences: 6.6% (0.4%, 12.9%); P = 0.04 and 9.3% (3.5%, 15.1%); P = 0.002) (not shown). In addition, disadvantaged HPI quartiles had smaller AAPC decreases with quartile 1 having a 2013 - 2022 AAPC of -4.5% (-10.6%, - 1.2%) and quartile 4 having a 2013 - 2022 AAPC of -12.8% (-16.6%, -9.9%). Pairwise comparison tests found the mortality rate trends between quartiles 1 (least advantaged) and 4 (most advantaged) differed significantly (2013 - 2022 AAPC difference: 8.3% (3.6%, 12.9%); P = 0.01) (not shown). Pairwise comparison tests found no significant differences in HCV mortality rate trends between males and females from 2005 to 2022 (P = 0.3); model fits and estimates for sex are not shown.
Click to view | Table 2. AAPC and APC in HCV Mortality Ratesa Per 100,000 Population, by Race and Ethnicity and Census Tract HPI Quartile, Alameda County, 2005 - 2022 |
| Discussion | ▴Top |
Our assessment found substantial burden of HBV and HCV mortality in Alameda County from 2005 to 2022. The burden and trend of HBV and HCV deaths point to opportunities to support targeted prevention and treatment efforts. Although overall HBV mortality rates remained unchanged from 2005 to 2022, overall HCV mortality rates declined from 2013 to 2022.
We identified HBV mortality disparities in the burden of deaths by race/ethnicity and nativity status. Although Asian residents make up 32.1% of Alameda County’s population, 73.2% of HBV decedents in Alameda County from 2005 to 2022 were Asian, and while 33% of the county’s population were non-US born, 82% of those who died with HBV were non-US born. Among those who are non-US born in Alameda County, in 2022, 64.6% were born in Asia, a region representing over 50% of the global HBV burden [1, 23]. These disparities in HBV mortality are consistent with assessments of HBV prevalence in the USA that have found Asians with higher chronic HBV infection and HBV mortality [5, 7, 15, 17, 24]. The Chronic Hepatitis Cohort Study describes that about half of the chronic hepatitis B cohort were Asian [14]. Our study found that the crude HBV mortality rate was highest among Asians at 56.6 per 100,000 population. The proportion of HBV decedents who are non-US born has been found to vary regionally but in areas such as the San Francisco Bay Area, a region that is home to large immigrant populations from endemic countries, chronic HBV infection and mortality have been found to disproportionately impact non-US born populations, especially non-US born Asians [5, 7, 17]. In a study enrolling Asian participants in HBV screening across the San Francisco Bay Area, 8.9% of enrolled participants were chronically infected. Among those found to be chronically infected, only one was born in the United States [25].
When examining how the HBV and HCV burden changed over time, we found that the overall crude HBV mortality rate remained unchanged throughout the period, in contrast to a national assessment that found a decline from 2000 to 2019 [7]. A possible explanation for this difference is that screening and timely identification of chronic HBV infection among immigrant Asian populations remains a challenge, especially in the San Francisco Bay Area [8, 15, 25, 26]. In the previous HBV screening study enrolling Asian participants, 65.4% of those chronically infected were unaware of their infection status and 44.9% had never been diagnosed with HBV infection [25]. Cultural, linguistic, and insurance barriers face chronically infected HBV immigrant populations regarding linkage to sustained HBV care [27]. In a similar HBV screening study conducted across New Jersey and the New York City metropolitan area enrolling Asian immigrants from 2009 to 2017, only 33.8% of those found to be chronically infected were successfully linked to care (LTC). After hiring nurse navigators in late 2017, however, LTC rates increased to 85.7% and 89.7% in 2018 and 2019, respectively, possibly providing an avenue in improving Asian immigrant HBV care [27]. In the San Francisco Bay Area, organizations such as San Francisco Hep B Free work to increase HBV screening among Asian and Pacific Islander residents while also engaging community providers in awareness and education on HBV treatment [28].
The overall HCV crude mortality rate followed a parabolic trend, with the rate decreasing since a peak in HCV deaths in 2012. Previous studies have found similar trends with HCV mortality rates steadily decreasing since a peak in deaths in 2013 [11, 12, 29]. The availability of curative treatments in early 2014 may explain this decline. One recent survival analysis examining direct acting anti-viral (DAA) treatment outcomes among a cohort of HCV-infected patients with advanced liver disease found that patients with sustained virologic responses (SVRs) to DAA treatment were significantly less likely to die than those that did not achieve SVR during the first year of follow-up [30]. In addition to available treatments, the advancing age of the 1945 - 1965 birth cohort, which had high HCV prevalence due to many factors when HCV screening and treatment did not exist, may explain some of this decline [31]. The overall rate of HCV mortality would decline as more recent infections among millennials take time to develop into advanced liver disease and death [32].
We found racial disparities with HCV deaths, and differing declines in HCV mortality by race and ethnicity and where people live. HCV deaths in Alameda County disproportionately affect African American/Black residents as this group makes up 10.7% of the population but constitute 34% of HCV decedents. This is consistent with racial disparity trends found in other studies where African American/Black persons had high rates of HCV mortality [4, 12, 17, 24]. Recent studies examining both insured and uninsured populations have found that African American/Black and Hispanic/Latinx persons are less likely to receive confirmatory HCV testing [33, 34]. Numerous studies have also shown that African American/Black and Hispanic/Latinx patients are less likely to get treated [35-39]. Interestingly, recent studies have also demonstrated that socio-economic disparities with HCV treatment exist. A Kaiser Northern California retrospective cohort study enrolling HCV-infected members found that patients residing in neighborhoods with a higher neighborhood deprivation index were less likely to initiate DAA treatment [38]. Similarly, numerous studies have also shown that Medicaid and indigently insured HCV patients were less likely to initiate DAA treatment [37, 38, 40].
Efforts to address HCV disparities across the continuum of care focus on decentralization and integration of HCV care from specialized practices to community primary care clinics, empowering community providers to effectively administer HCV screening and care, and recruitment of patient navigators trained to actively guide patients through the continuum of care [41]. The scarcity of hepatologists in the United States has created an HCV treatment bottleneck that especially affects the most vulnerable [41]. Decentralization of HCV care could improve this bottleneck as HCV care and treatment is expanded to primary care clinics. A recent randomized controlled trial recruiting HCV-infected people who inject drugs (PWID) found that those assigned to receive HCV care in primary care clinics were more likely to initiate treatment and achieve SVR than those assigned to receive standard HCV care [42]. Integration of a specialist with primary care in correctional facilities, substance abuse centers, and needle exchange programs has been shown to also increase treatment initiation and SVR rates among vulnerable populations such as PWID [41, 43]. However, effective integration of HCV care in primary care settings requires that primary care providers (PCPs) be trained to test and treat HCV patients. A study training PCPs and nurse practitioners in HCV care across multiple federally qualified health centers found that HCV patients assigned to be treated by these providers achieved similar SVR rates to those assigned to specialists [44]. Methods to train PCPs include telemonitoring efforts connecting hepatology and infectious disease specialists with community providers to offer HCV care training and guidance [41]. The Expanding Capacity for Healthcare Outcomes (ECHO) project is one such specialist-PCP telemonitoring effort utilized by the University of California, San Francisco (UCSF) to expand the network of PCPs that can effectively treat HCV [45]. Effective strategies for HCV testing and treatment that can reach the most vulnerable populations are needed to address the disparities identified in HCV mortality in Alameda County.
Our analysis had several important limitations. Death certificate MCOD data using ICD-10 may inaccurately describe HBV and HCV deaths because it is provider dependent and not based on systematic review of medical records, history, or pathology. Previous studies have shown that among decedents with documented complications of either chronic hepatitis B or C, a large proportion did not have HBV or HCV listed in the death certificate [15, 46]. Also, our study did not have a comparison decedent group. However, our findings are consistent with previous HBV and HCV mortality studies that have used a comparison group [4, 7, 12, 15, 17, 24]. Finally, death certificate data are cross-sectional and there is limited information associated with each death resulting in several important limitations. First, we are not able to definitively determine if listed adverse liver outcomes are truly caused by HBV and/or HCV or simply co-incidental. Second, HBV and HCV treatment data are not available on death certificates inhibiting our ability to examine mortality by treatment status and thus definitively attribute mortality disparities to disparities in treatment. Also, the lack of accompanying laboratory data prohibits us from examining mortality by disease state. For example, we could not determine if an HBV decedent’s infection was well controlled due to treatment at time of death or if an HCV decedent’s HCV COD was listed due to an active untreated infection or a past infection that was successfully treated but still listed in the death certificate. Finally, in our analysis some assessments were limited by sample size, such as further stratification of HBV deaths by HPI and race/ethnicity. When feasible, evaluation of disaggregated data is important to describe the social determinants of HBV and HCV mortality.
Our findings highlight focus areas to reach HBV and HCV elimination targets. The unchanging HBV mortality rate suggests culturally appropriate and targeted approaches to reach non-US born and Asian and Pacific Islander persons for screening and treatment are needed in Alameda County to reduce HBV mortality rates. Encouragingly, HCV mortality rates declined for all groups examined (sex, race/ethnicity, HPI quartile) from 2013 to 2022 in Alameda County. However, the differing mortality declines by race/ethnicity and HPI quartile suggests that targeted efforts, such as a focus on training community providers serving African American/Blacks and persons that are challenged with poverty or limited healthcare access could be beneficial. By ensuring primary care, street medicine, and correctional settings have the capacity to screen and treat, especially in underserved settings in Alameda County, we are more likely to close the gap and ensure all can benefit from HCV treatment. Other local jurisdictions could benefit from evaluating viral hepatitis metrics such as deaths, to identify focus areas for prevention.
| Supplementary Material | ▴Top |
Suppl 1. ICD-10 Codes Used to Define Decedent Conditions.
Acknowledgments
None to declare.
Financial Disclosure
All funding from Alameda County Public Health Department.
Conflict of Interest
Robert J. Wong receives funding from Gilead Sciences, Exact Sciences, Durect Corporation, and Theratechnologies; Eileen F. Dunne has received funding from Merck and Sanofi for short-term consultation on Chlamydia and HPV vaccine. All other authors declare that they have no conflict of interest.
Informed Consent
This activity was performed as a part of public health program evaluation.
Author Contributions
All authors contributed to the conceptualization, writing, and review of the manuscript. BT led the analysis and development of data figures and tables for the manuscript. EY and MB provided secondary review of the analysis and the distillation of findings.
Data Availability
The data used for this analysis were from vital statistics. Parts of the data may be available for secondary assessment that has personally identifiable information (PII) removed.
| References | ▴Top |
- World Health Organization. Global hepatitis report 2024: action for access in low- and middle-income countries. World Health Organization, Geneva, 2024. Accessed: Apr. 29, 2024. [Online]. Available: https://www.who.int/publications-detail-redirect/9789240091672.
- The Centers for Disease Control and Prevention (CDC). 2021 Viral Hepatitis Surveillance National Profile of Viral Hepatitis. Accessed: Mar 25, 2024. [Online]. Available: https://www.cdc.gov/hepatitis/statistics/2021surveillance/introduction/national-profile.htm.
- Ly KN, Yin S, Spradling PR. Disparities in social vulnerability and premature mortality among decedents with hepatitis B, United States, 2010-2019. J Racial Ethn Health Disparities. 2025;12(2):1344-1356.
doi pubmed - Ly KN, et al. Deaths associated with hepatitis C virus infection among residents in 50 states and the district of Columbia, 2016-2017. Clin Infect Dis. 2020;71(5):1149-1160.
doi - Toy M, Wei B, Virdi TS, Le A, Trinh H, Li J, Zhang J, et al. Racial/ethnic- and county-specific prevalence of chronic hepatitis B and its burden in California. Hepatol Med Policy. 2018;3:6.
doi pubmed - Chronic hepatitis C infections in California surveillance report 2018. California Department of Public Health, Sexually Transmitted Diseases (STD) Control Branch, Office of Viral Hepatitis Prevention, Surviellance, 2018. Accessed: Apr 10, 2024. [Online]. Available: https://www.cdph.ca.gov/Programs/CID/DCDC/CDPH%20Document%20Library/Chronic-Hepatitis-C-Infections-in-California-Surveillance-Report-2018-Data-Tables.pdf.
- Ly KN, Yin S, Spradling PR. Regional differences in mortality rates and characteristics of decedents with hepatitis B listed as a cause of death, United States, 2000-2019. JAMA Netw Open. 2022;5(6):e2219170.
doi pubmed - National Academies of Sciences, Engineering, and Medicine. In: Buckley GJ, Strom BL, eds. Eliminating the public health problem of hepatitis B and C in the United States: Phase One Report. Washington (DC), The National Academies Press. 2016.
doi pubmed - World Health Organization. Guidance for national strategic planning: health sector response to HIV, viral hepatitis and sexually transmitted infections. 2023. Accessed: Apr 10, 2024. [Online]. Available: https://www.who.int/publications-detail-redirect/9789240076389.
- U.S. Department of Health and Human Services. Viral hepatitis national strategic plan for the United States: a roadmap to elimination (2021-2025). HHS. 2020. Accessed: Jan 30, 2024. [Online]. Available: https://www.hhs.gov/sites/default/files/Viral-Hepatitis-National-Strategic-Plan-2021-2025.pdf.
- Hall EW, Schillie S, Vaughan AS, Jones J, Bradley H, Lopman B, Rosenberg ES, et al. County-level variation in hepatitis C virus mortality and trends in the United States, 2005-2017. Hepatology. 2021;74(2):582-590.
doi pubmed - Mirzazadeh A, Facente SN, Burk K, Kahn JG, Morris MD, End Hep CS. Hepatitis C mortality trends in San Francisco: can we reach elimination targets? Ann Epidemiol. 2022;65:59-64.
doi pubmed - U.S. Census Bureau. Selected characteristics of the native and foreign-born populations. American Community Survey. 2022. Accessed: May 9, 2024. [Online]. Available: https://data.census.gov/table/ACSST5Y2022.S0501?q=Alameda County, California&g=060XX00US0600190020.
- World Health Organization. International Classification of Diseases (ICD). International Statistical Classification of Diseases and Related Health Problems (ICD). Accessed: Feb 11, 2024. [Online]. Available: https://www.who.int/standards/classifications/classification-of-diseases.
- Bixler D, Zhong Y, Ly KN, Moorman AC, Spradling PR, Teshale EH, Rupp LB, et al. Mortality among patients with chronic hepatitis B infection: the chronic hepatitis cohort study (CHeCS). Clin Infect Dis. 2019;68(6):956-963.
doi pubmed - Hirode G, Saab S, Wong RJ. Trends in the burden of chronic liver disease among hospitalized US adults. JAMA Netw Open. 2020;3(4):e201997.
doi pubmed - The Centers for Disease Control. Viral Hepatitis Surveillance - United States, 2016. CDC Surviellance, 2016. Accessed: Jan 26, 2024. [Online]. Available: https://www.cdc.gov/hepatitis/statistics/2016surveillance/pdfs/2016hepsurveillancerpt.pdf.
- Smith Sehdev AE, Hutchins GM. Problems with proper completion and accuracy of the cause-of-death statement. Arch Intern Med. 2001;161(2):277-284.
doi pubmed - Maizlish N, Delaney T, Dowling H, Chapman DA, Sabo R, Woolf S, Orndahl C, et al. California healthy places index: frames matter. Public Health Rep. 2019;134(4):354-362.
doi pubmed - ACPHD CAPE. Data from Esri Updated Demographics, 2005-2019. Accessed: Jan 06, 2025. [Online]. Available: https://acphd.org/data-reports/.
- Joinpoint Regression Program. May 2023. Statistical methodology and applications branch, surveillance research program. National Cancer Institute. Accessed: Feb 12, 2024. [Online]. Available: https://surveillance.cancer.gov/joinpoint/.
- Kim HJ, Fay MP, Feuer EJ, Midthune DN. Permutation tests for joinpoint regression with applications to cancer rates. Stat Med. 2000;19(3):335-351.
doi pubmed - U.S. Census Bureau. Selected Social Characteristics in the United States. American Community Survey, 2022. Accessed: May 09, 2024. [Online]. Available: https://data.census.gov/table/ACSDP1Y2022.DP02?g=050XX00US06001.
- Ly KN, Xing J, Klevens RM, Jiles RB, Holmberg SD. Causes of death and characteristics of decedents with viral hepatitis, United States, 2010. Clin Infect Dis. 2014;58(1):40-49.
doi pubmed - Lin SY, Chang ET, So SK. Why we should routinely screen Asian American adults for hepatitis B: a cross-sectional study of Asians in California. Hepatology. 2007;46(4):1034-1040.
doi pubmed - Kilmer GA, Barker LK, Ly KN, Jiles RB. Hepatitis B vaccination and screening among foreign-born women of reproductive age in the United States: 2013-2015. Clin Infect Dis. 2019;68(2):256-265.
doi pubmed - Win A, King S, Wu G, Kwon S. Hepatitis B virus screening in Asian immigrants: Community-based campaign to increase screening and linkage to care: A cross-sectional study. Health Sci Rep. 2023;6(3):e773.
doi pubmed - San Fransisco Hep B Free. San Fransisco Hep B Free - About Us. sfhepbfree. Accessed: May 28, 2024. [Online]. Available: https://www.sfhepbfree.org/about.
- Ly KN, Hughes EM, Jiles RB, Holmberg SD. Rising Mortality Associated With Hepatitis C Virus in the United States, 2003-2013. Clin Infect Dis. 2016;62(10):1287-1288.
doi pubmed - Backus LI, Belperio PS, Shahoumian TA, Mole LA. Impact of sustained virologic response with direct-acting antiviral treatment on mortality in patients with advanced liver disease. Hepatology. 2019;69(2):487-497.
doi pubmed - Joy JB, et al. Phylogenetic estimation of the temporal spread of hepatitis C genotype 1a in North America: a retrospective phylogenetic study. Lancet Infect Dis. 2016;16(6):698-702.
doi - Ryerson AB, Schillie S, Barker LK, Kupronis BA, Wester C. Vital signs: newly reported acute and chronic hepatitis C cases - United States, 2009-2018. MMWR Morb Mortal Wkly Rep. 2020;69(14):399-404.
doi pubmed - Kim NJ, Locke CJ, Park H, Magee C, Bacchetti P, Khalili M. Race and hepatitis C care continuum in an underserved birth cohort. J Gen Intern Med. 2019;34(10):2005-2013.
doi pubmed - Tran L, Jung J, Feldman R, Riley T, 3rd. Disparities in the quality of care for chronic hepatitis C among Medicare beneficiaries. PLoS One. 2022;17(3):e0263913.
doi pubmed - Gomes C, Ginzberg D, Wong RJ. Delays and gaps in progressing through the hepatitis C virus cascade of care: an underserved safety-net hospital experience. J Transl Int Med. 2020;8(4):261-267.
doi pubmed - Kapadia SN, Zhang H, Gonzalez CJ, Sen B, Franco R, Hutchings K, Wethington E, et al. Hepatitis C treatment initiation among US medicaid enrollees. JAMA Netw Open. 2023;6(8):e2327326.
doi pubmed - Wong RJ, Jain MK, Therapondos G, Shiffman ML, Kshirsagar O, Clark C, Thamer M. Race/ethnicity and insurance status disparities in access to direct acting antivirals for hepatitis C virus treatment. Am J Gastroenterol. 2018;113(9):1329-1338.
doi pubmed - Marcus JL, Hurley LB, Chamberland S, Champsi JH, Gittleman LC, Korn DG, Lai JB, et al. Disparities in initiation of direct-acting antiviral agents for hepatitis C virus infection in an insured population. Public Health Rep. 2018;133(4):452-460.
doi pubmed - Thompson WW, Symum H, Sandul A, Dhsc, Gupta N, Patel P, Nelson N, et al. Vital signs: hepatitis C treatment among insured adults - United States, 2019-2020. MMWR Morb Mortal Wkly Rep. 2022;71(32):1011-1017.
doi pubmed - Lo Re V, 3rd, Gowda C, Urick PN, Halladay JT, Binkley A, Carbonari DM, Battista K, et al. Disparities in absolute denial of modern hepatitis C therapy by type of insurance. Clin Gastroenterol Hepatol. 2016;14(7):1035-1043.
doi pubmed - Jones AT, Briones C, Tran T, Moreno-Walton L, Kissinger PJ. Closing the hepatitis C treatment gap: United States strategies to improve retention in care. J Viral Hepat. 2022;29(8):588-595.
doi pubmed - Wade AJ, Doyle JS, Gane E, Stedman C, Draper B, Iser D, Roberts SK, et al. Outcomes of treatment for hepatitis C in primary care, compared to hospital-based care: a randomized, controlled trial in people who inject drugs. Clin Infect Dis. 2020;70(9):1900-1906.
doi pubmed - Radley A, Robinson E, Aspinall EJ, Angus K, Tan L, Dillon JF. A systematic review and meta-analysis of community and primary-care-based hepatitis C testing and treatment services that employ direct acting antiviral drug treatments. BMC Health Serv Res. 2019;19(1):765.
doi pubmed - Kattakuzhy S, Gross C, Emmanuel B, Teferi G, Jenkins V, Silk R, Akoth E, et al. Expansion of treatment for hepatitis C virus infection by task shifting to community-based nonspecialist providers: a nonrandomized clinical trial. Ann Intern Med. 2017;167(5):311-318.
doi pubmed - UCSF Viral Hepatitis Center. UCSF Viral Hepatitis Center - about ECHO. UCSF Viral Hepatitis Center. Accessed: May 28, 2024. [Online]. Available: https://viralhep.ucsf.edu/echo/about.
- Spradling PR, Zhong Y, Moorman AC, Rupp LB, Lu M, Teshale EH, Schmidt MA, et al. The persistence of underreporting of hepatitis C as an underlying or contributing cause of death, 2011-2017. Clin Infect Dis. 2021;73(5):891-894.
doi pubmed
This article is distributed under the terms of the Creative Commons Attribution Non-Commercial 4.0 International License, which permits unrestricted non-commercial use, distribution, and reproduction in any medium, provided the original work is properly cited.
Gastroenterology Research is published by Elmer Press Inc.